Editor’s Note—This article is one in a series about how NASA and other science institutions measure and monitor sea level rise. Find the other stories here.
Just like forests can grow and shrink over time, so do glaciers, ice shelves, and ice sheets. Sometimes, ice grows through snow accumulation. Other times, it loses mass from melting or from calving icebergs. With modern satellites, scientists can measure and monitor these gains and losses with ever-increasing precision.
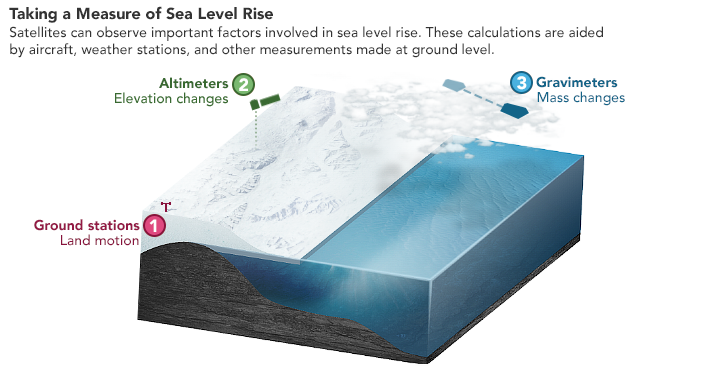
One key measurement for assessing the health of these frozen reservoirs is ice height, which scientists use to calculate mass changes over time. Researchers combine ice height measurements with other observations to determine the thickness and volume of a piece of ice, which is then converted into mass.
In recent decades, Earth’s ice-covered regions have been losing more mass than they are gaining. Rising global temperatures are melting glaciers and ice sheets, reducing their thickness, length, and mass. The water from that melted ice flows into the ocean and adds to its volume: Scientists estimate that every 360 gigatons of added melt water raises global sea level by one millimeter. While melting ice is not the only contributor to sea level rise, satellite records since the 1990s show that it has been the largest contributor.
Scientists can use radar and laser altimeters to measure changes to ice elevation. These remote sensing instruments operate by sending radio or laser light pulses toward Earth’s surface and recording the reflections as they bounce back. By measuring the time between the outgoing and returning signal, and knowing the precise altitude of the satellite above ground, scientists can calculate the elevation of the ice surface. Then by comparing multiple altimeter passes over months and years, they can derive surface changes over time.
Although radar and laser altimeters use similar methodology, the two operate at different frequencies and return different information. Radar altimeters use microwave frequencies that illuminate large swaths on the ice sheets (for instance, a 1700-meter diameter). The instruments can “see” the surface in all atmospheric conditions, regardless of clouds, and the signals can penetrate snow to see ice layers. Lasers use shorter wavelengths that are focused into very narrow beams; they observe smaller patches of the surface. (ICESat-2, for instance, has a footprint with a 14-meter diameter.) Lasers cannot penetrate thick clouds, and their signals reflect off the top of the snow layer.
The two types of measurements are complementary. Radars can observe more ice area with greater frequency, but less precision. Laser altimeters can return more precise data about the ice surface, particularly over steeply sloping areas, but it observes the same swaths less often.
NASA’s Seasat was the first satellite to measure ice elevation from space, gathering data for three months in 1978 via radar altimeter. Since then, several more satellite radar altimeters have been flown by the U.S. Navy, the European Space Agency (ESA), and other international space agencies, including GEOSAT, ERS-1, ERS-2, Envisat, AltiKa, CryoSat-2, and the Copernicus Sentinel missions. Radar altimeters have provided continuous ice elevation data for Greenland and Antarctica since 1991.
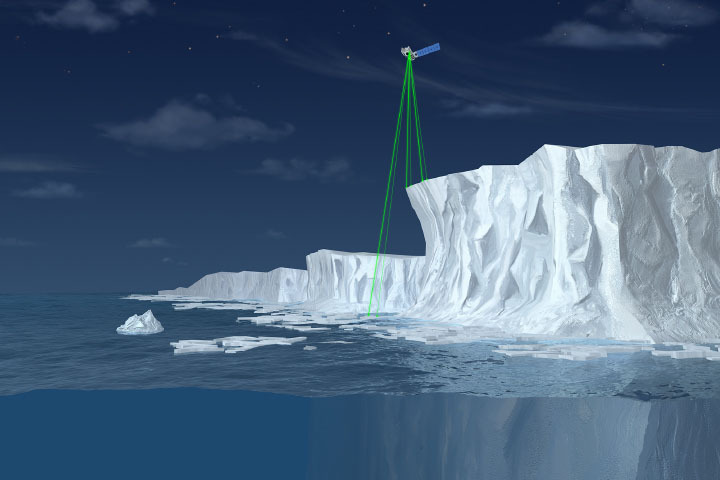
In 2003, NASA launched the first Earth-observing laser altimeter aboard the Ice, Cloud and land Elevation Satellite (ICESat), which was also the first altimetry mission specifically designed to observe ice. ICESat operated until 2010, and NASA launched a more advanced ICESat-2 in 2018. While the first generation satellite carried three lasers that fired 40 pulses of infrared light per second and took measurements every 170 meters (560 feet), the successor carries two green lasers that fire 10,000 pulses per second and collect data every 70 centimeters (30 inches). ICESat-2 gathers enough data to estimate the annual height change of the Greenland and Antarctic Ice Sheets to within 4 millimeters (0.2 inches).
Since July 2020, ESA’s CryoSat-2 and NASA’s ICESat-2 have been flying in orbits that periodically overlap in the Arctic in order to enable simultaneous radar and laser observations. Those synchronized overpasses will allow scientists to make better measurements of sea ice thickness.
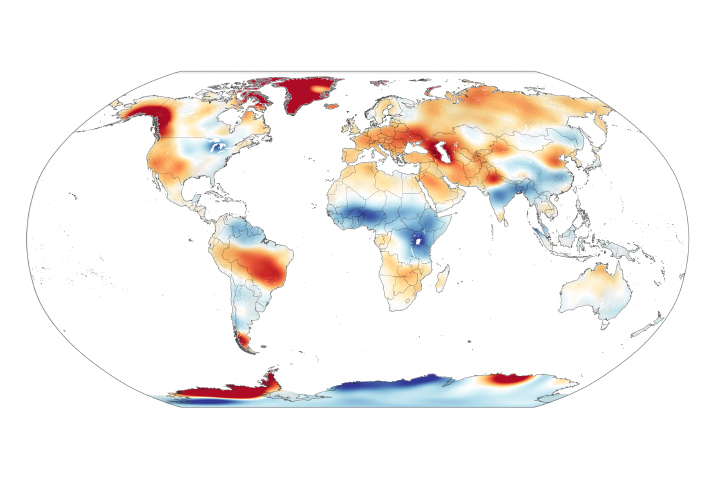
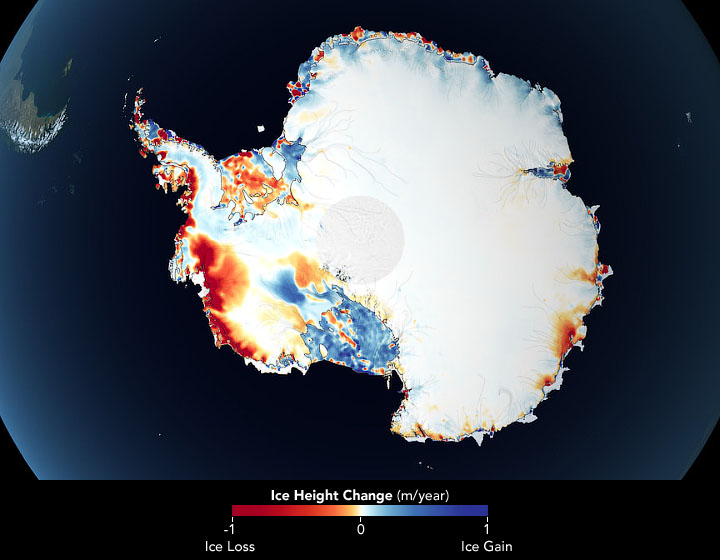
With Earth’s ice steadily shrinking, scientists are trying to understand the exact locations and pace of the changes. The map below shows changes in land ice thickness in Antarctica between 2003-2009 and 2018-2019, as measured by ICESat and ICESat-2. (Similar measurements have also been mapped for Greenland.)
In a study published in June 2020, scientists found that ice losses around the edges of Greenland and West Antarctica have contributed 14 millimeters (0.55 inches) to sea level rise since 2003. That is one third of the total amount of sea level rise observed over that period.
Mass losses in Greenland exceeded those in Antarctica during those 16 years. Researchers found that Greenland lost an average of 200 gigatons of ice per year, much of it from coastal glaciers. Analyzing various datasets, the scientists found that the main driver of loss in Greenland was surface melting due to ever-warmer summer temperatures. Warmer ocean water also eroded the glaciers at their fronts in some basins.
Antarctica’s ice sheet, which is about eight times larger than Greenland’s, has been losing around 118 gigatons of ice per year across the continent. Further analysis showed that warmer ocean temperatures caused most of the West Antarctic ice loss. Significant snow and ice accumulation in parts of East Antarctica offset some of those losses.
Ice scientists are currently working to build better ice mass balance models by combining observations from ICESat and ICESat-2 with those from the Gravity Recovery and Climate Experiment (GRACE) and GRACE-Follow On satellites. Another effort called the Ice Sheet Mass Balance Inter-comparison Exercise (IMBIE) combines data from 13 NASA and ESA missions to create mass change models. Scientists also use ice height in models of how ice sheets may change in the future, such as in the Ice Sheet Model Intercomparison Project (ISMIP6) that brings together ice sheet modeling groups around the world.
Find more stories about our changing oceans and coasts in Earth Observatory’s sea level rise collection. Explore other stories of sea level by our NASA colleagues in Rising Waters.
Looking for data related to sea level rise? The Sea Level Change Data Pathfinder on NASA’s Earthdata site highlights tools used by researchers to study ice sheet altimetry, including ICESat Global Antarctic and Greenland Ice Sheet Altimetry Data, ICESat-2 Land Ice Height, GRACE and GRACE-FO Greenland Ice Mass Anomalies, and Antarctic Ice Mass Anomalies.
Images by NASA’s Scientific Visualization Studio/Kel Elkins and NASA Earth Observatory/Joshua Stevens. Story by Kasha Patel, with scientific input from Thomas Neumann/NASA Goddard, Nathan Kurtz/NASA Goddard, Ben Smith/University of Washington, and Helen Fricker/University of California-San Diego.