In early February 2020, scientists using NASA and European satellites detected a significant reduction in a key air pollutant over China after the country shut down transportation and much of its economy. Three months later, with most coronavirus (COVID-19) lockdowns ending in China and economic activity resuming, the levels of nitrogen dioxide over the country have returned to near normal for this time of year. Scientists expected this rebound.
Nitrogen dioxide (NO2) is a noxious gas emitted primarily through the burning of gasoline, coal, and diesel fuel by motor vehicles, power plants, and industrial facilities. Near the ground, NO2 can turn into ozone that makes air hazy and unhealthy to breathe. Higher in the atmosphere, it can form acid rain. Scientists in the Atmospheric Chemistry and Dynamics Laboratory at NASA’s Goddard Space Flight Center have been monitoring nitrogen dioxide and other aspects of global air quality for several decades.
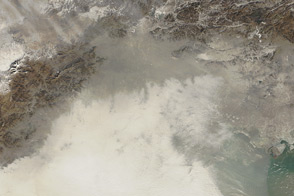
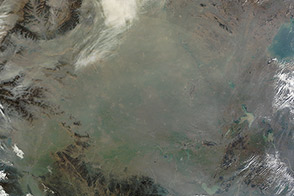
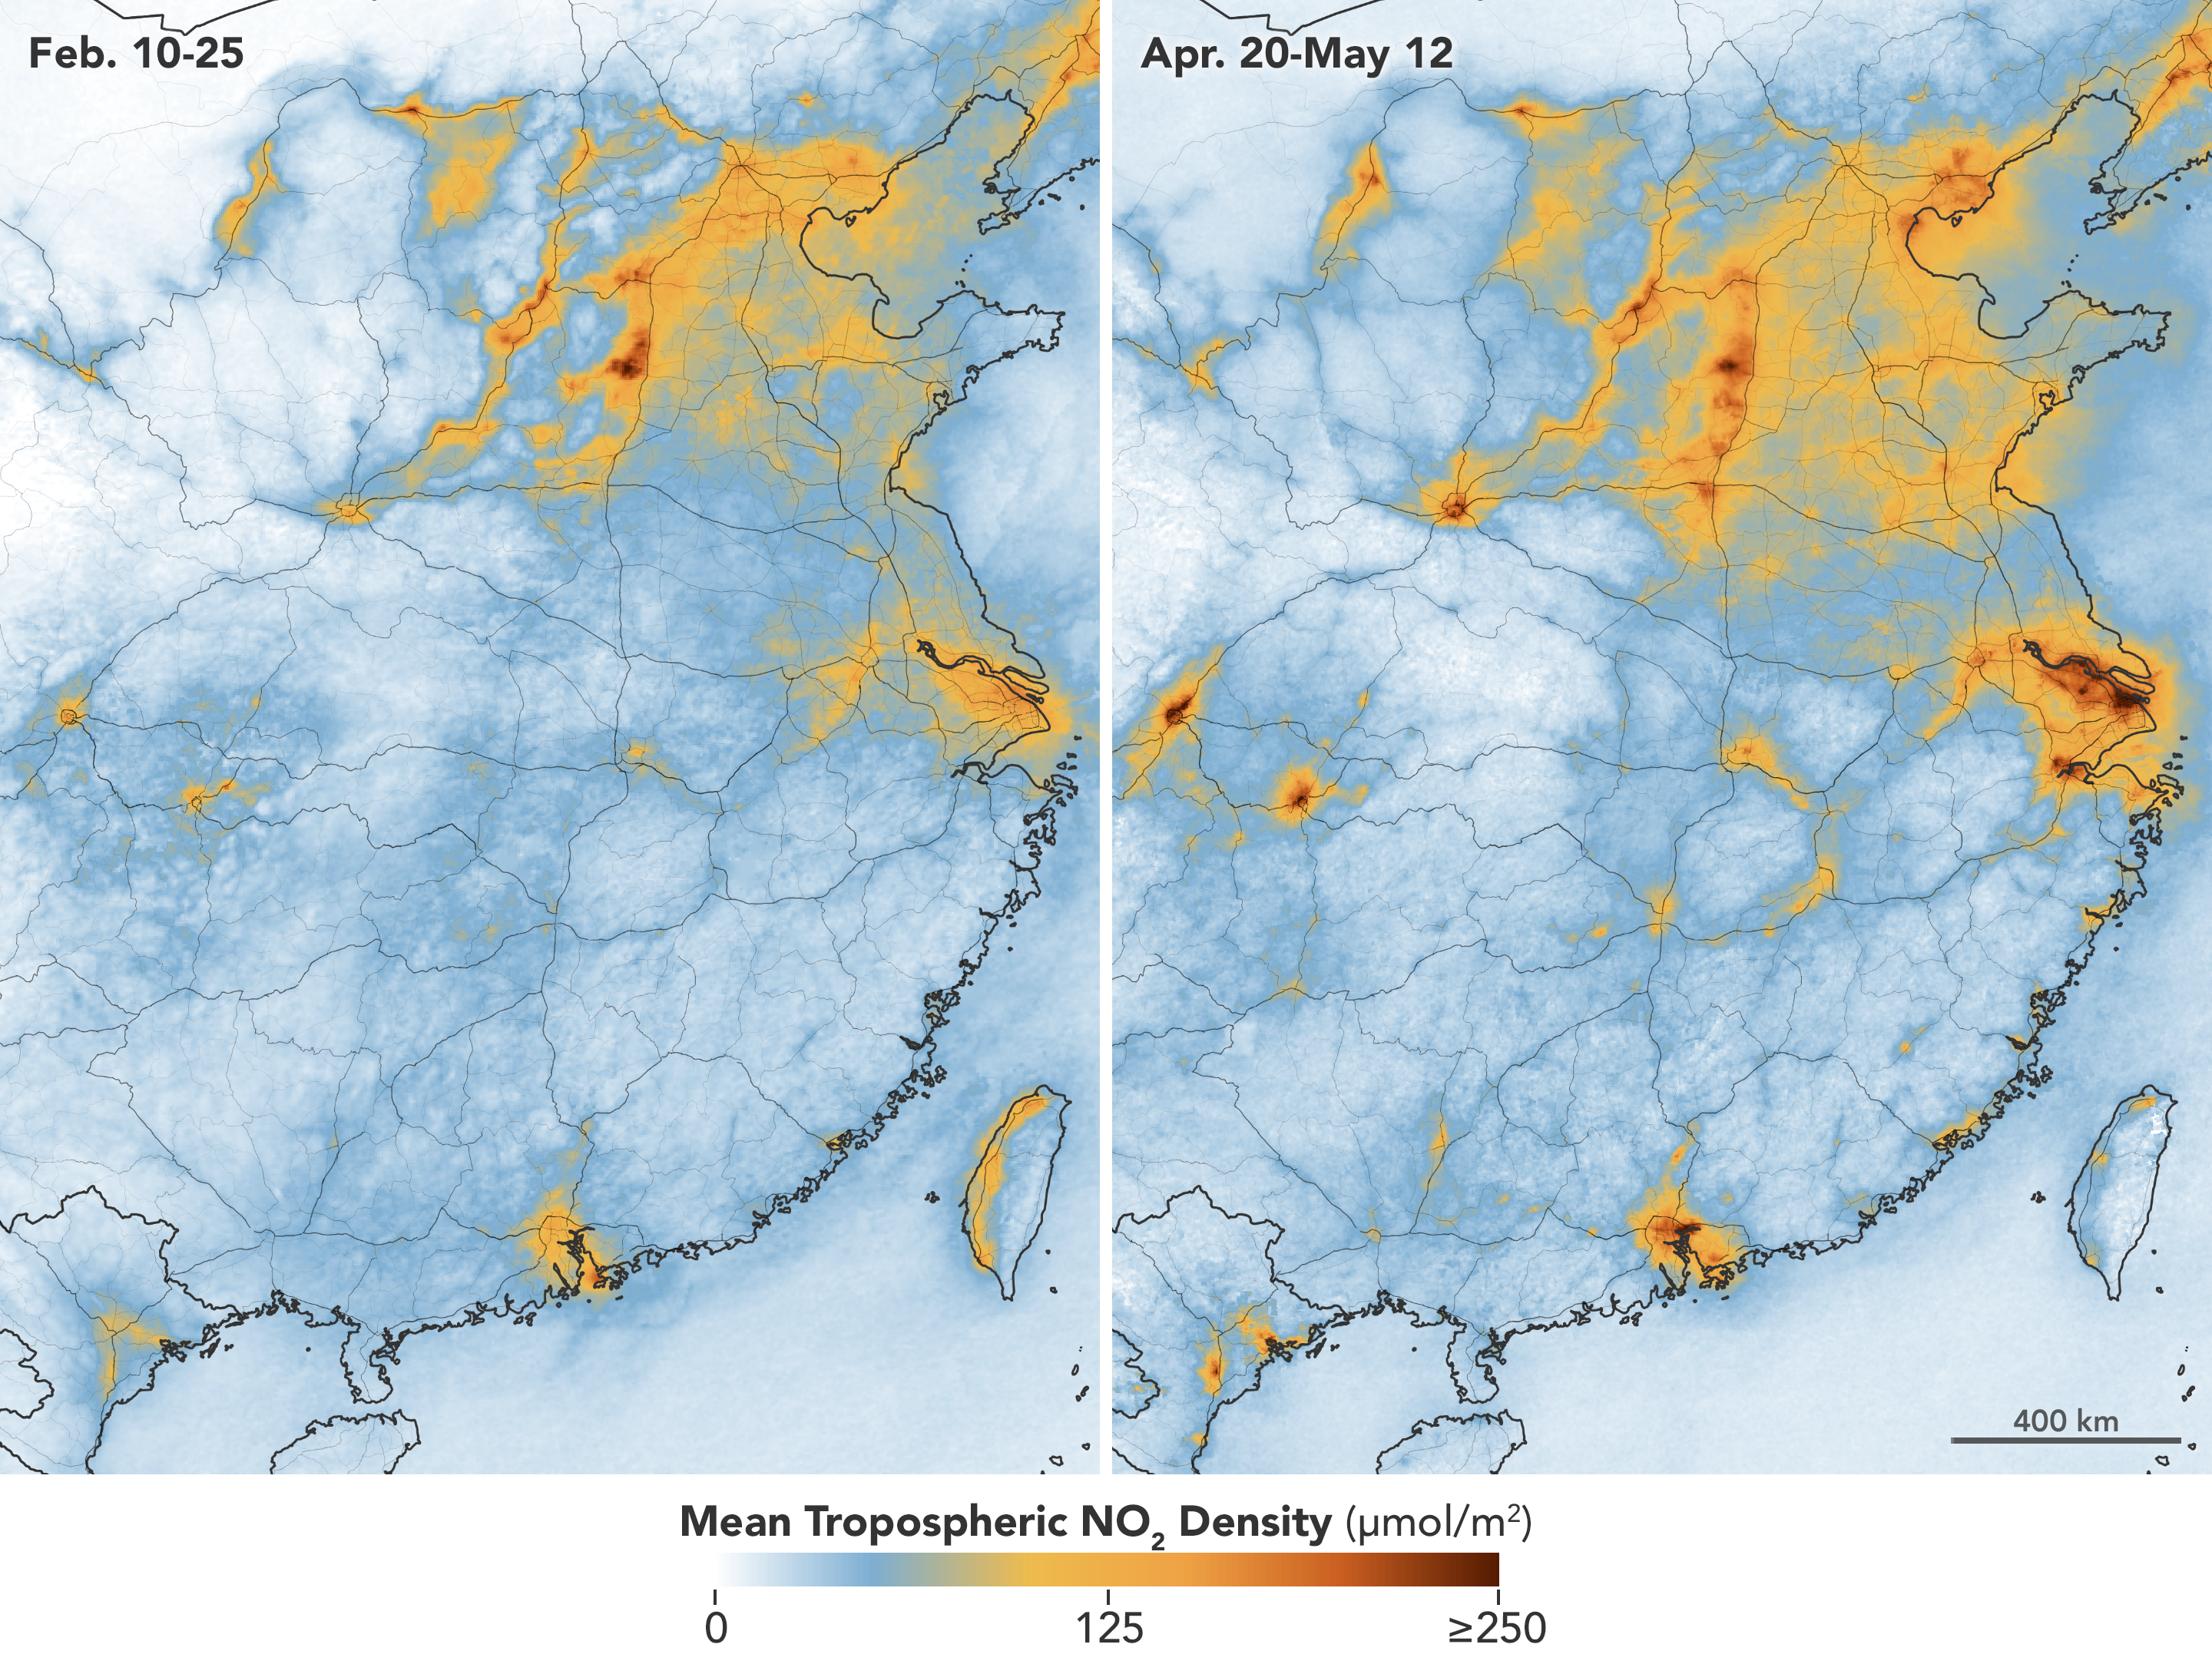
The maps on this page show levels of nitrogen dioxide in the troposphere (the lowest layer of the atmosphere) over China. The maps above show NO2 levels in central and eastern portions of the country from February 10–25 (during the quarantine) and April 20 to May 12 (after restrictions were lifted).
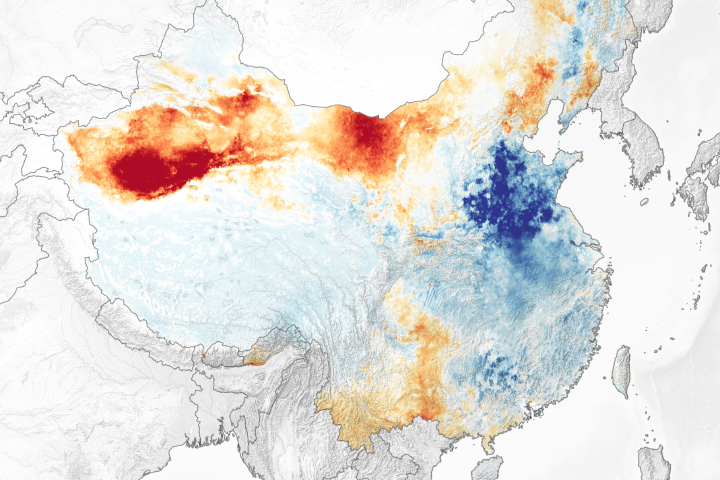
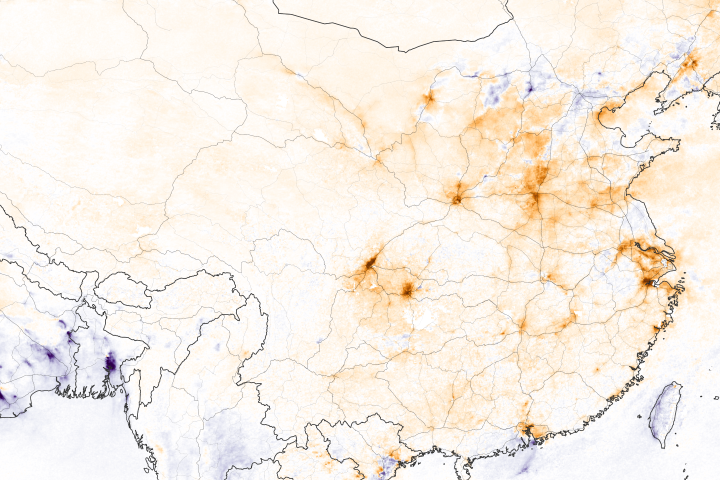
The map below shows the changes in NO2 levels between the two periods. Orange areas depict increases (mainly in China) since February, while blue areas have seen decreases (such as India and Bangladesh, which were still under quarantine). These data were collected by the Tropospheric Monitoring Instrument (TROPOMI) on the European Commission’s Copernicus Sentinel-5P satellite, built by the European Space Agency.
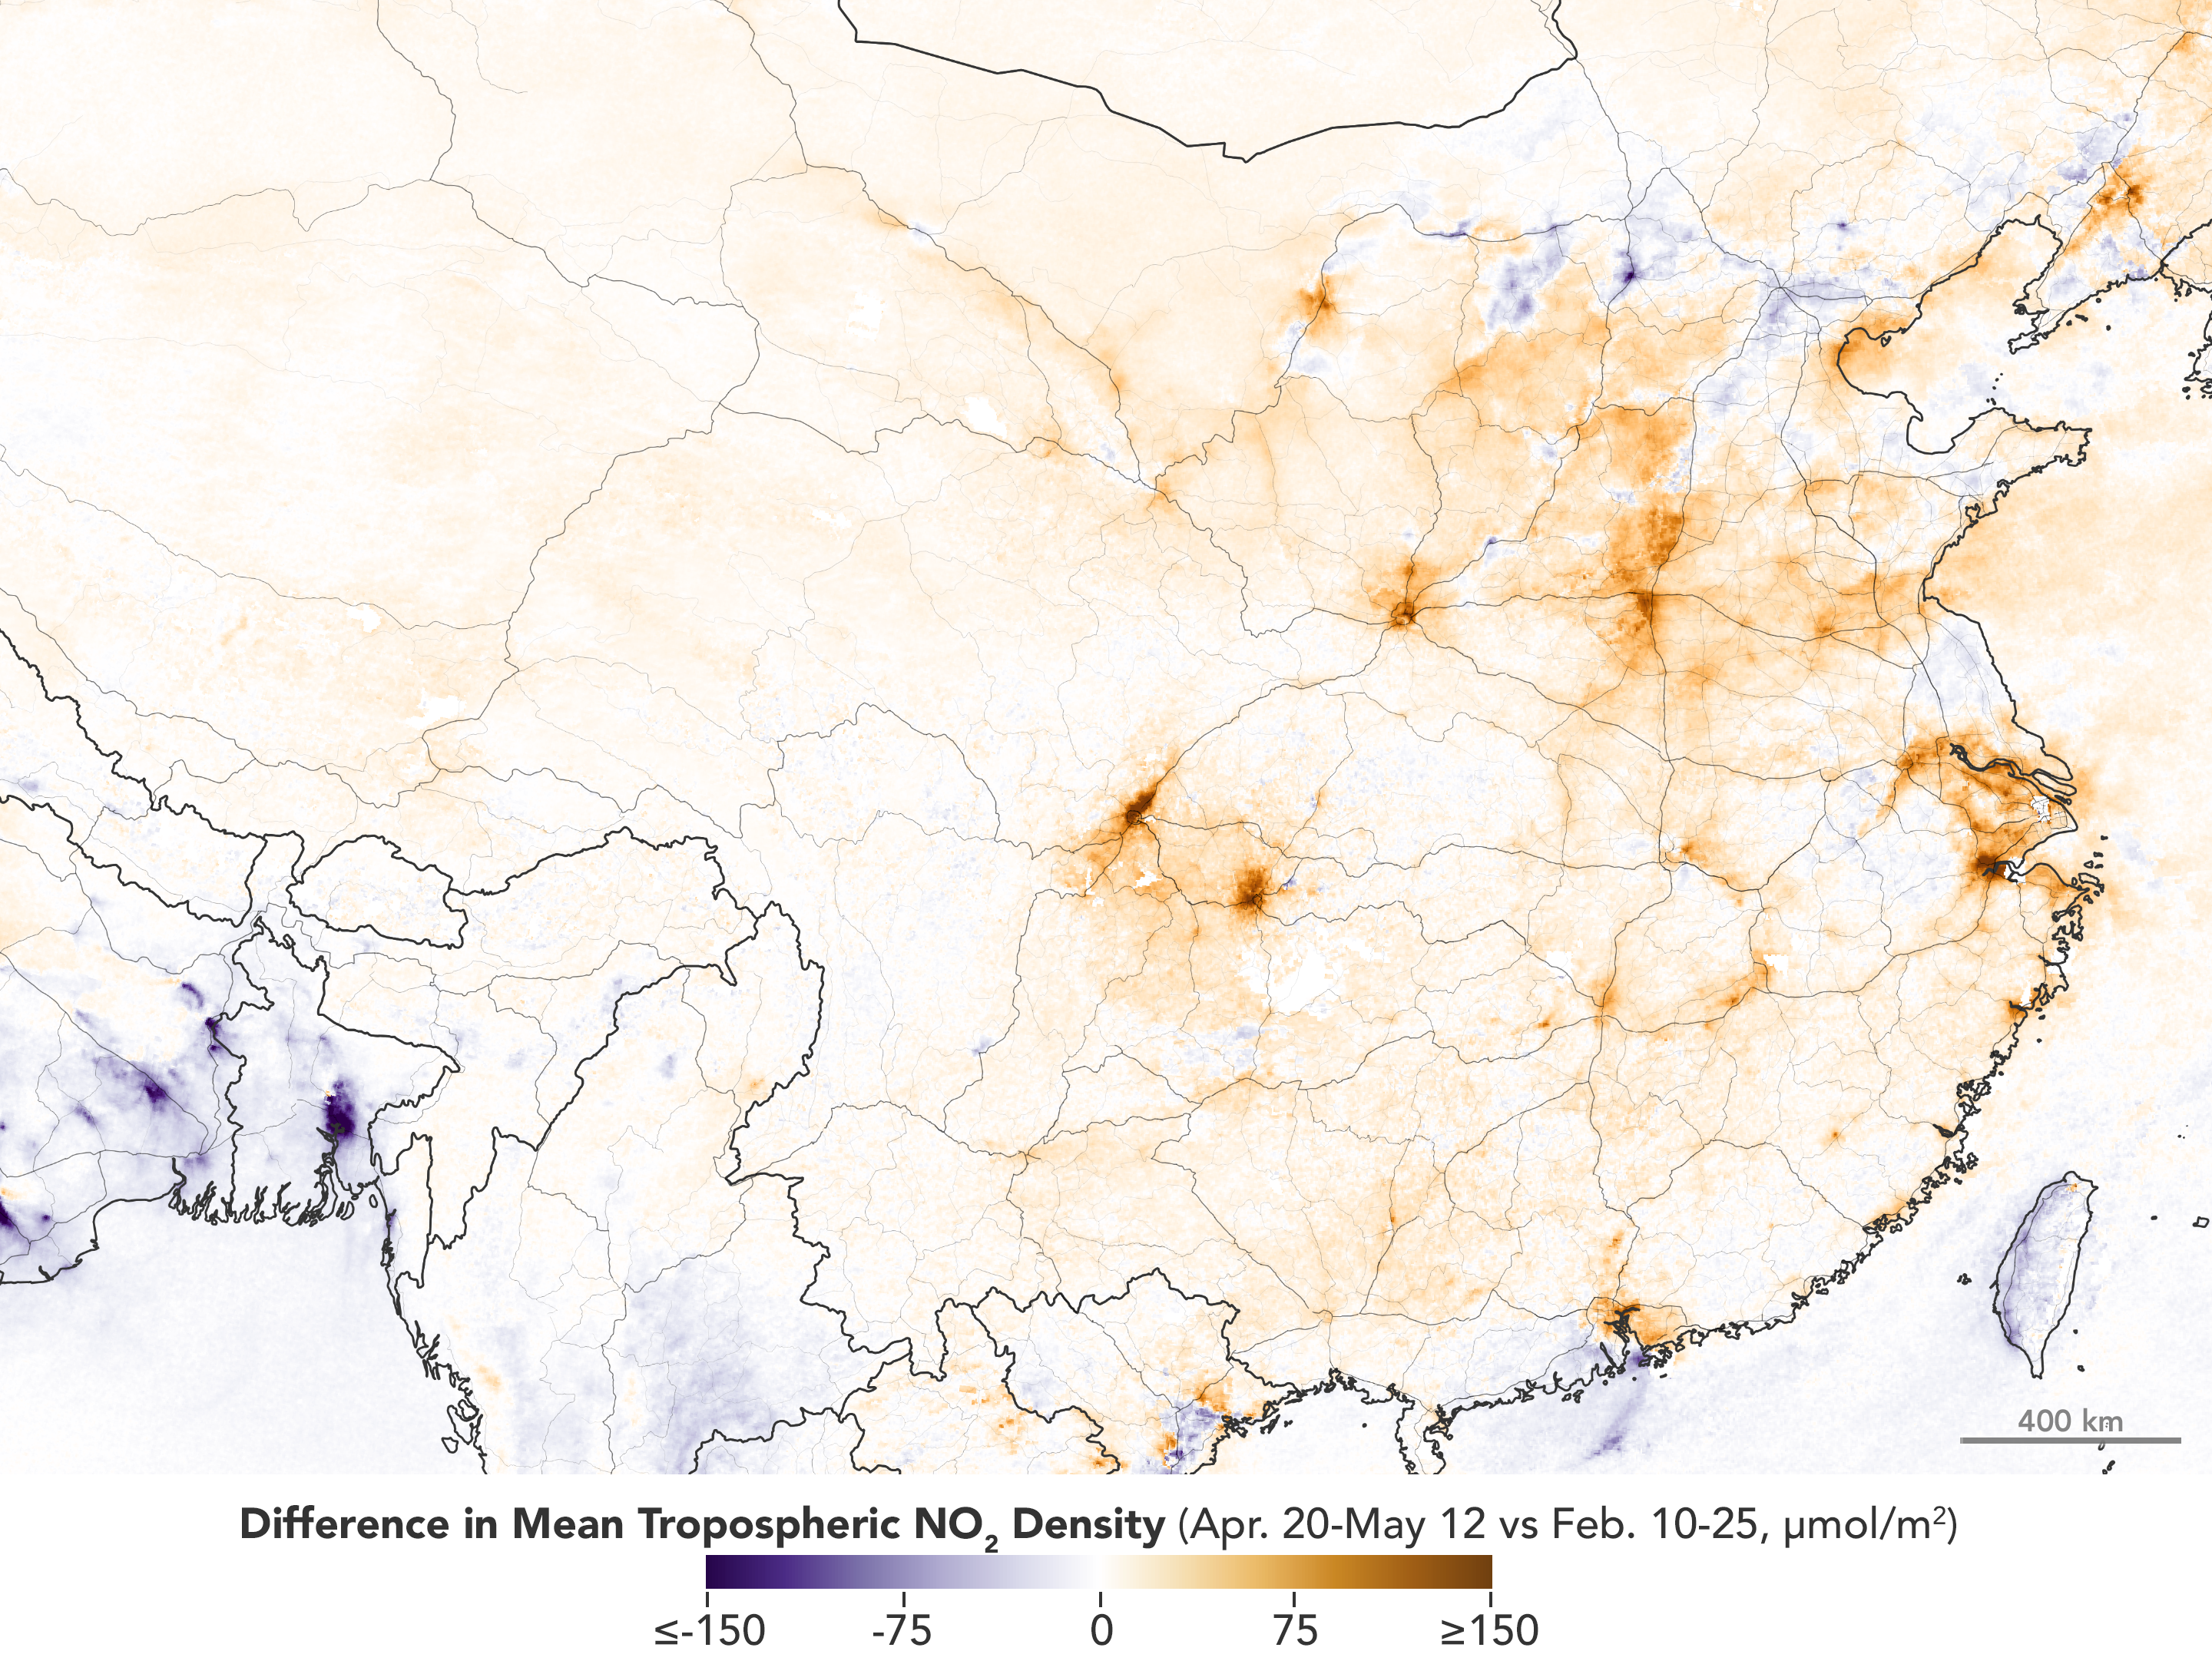
The predecessor to TROPOMI, the Ozone Monitoring Instrument (OMI) on NASA’s Aura satellite, has been making comparable measurements since 2004. Though OMI provides lower spatial resolution, it has a longer data record that can put pollution changes into context. OMI has recorded similar trends in 2020 over China as observed with TROPOMI. (To view OMI’s NO2 data for more than 200 cities around the world, click here.)
The plot below shows the mean column density of nitrogen dioxide—how much NO2 would be found in a column of air stretching up through the troposphere—over China as measured by OMI in 2020 (red line) and from 2015-2019 (blue lines). Time is measured in days before and after the Lunar New Year began. (In 2020, it started on January 25.) Past research has shown that air pollution in China usually decreases during New Year’s celebrations and then increases slowly in the month after the celebrations are over.
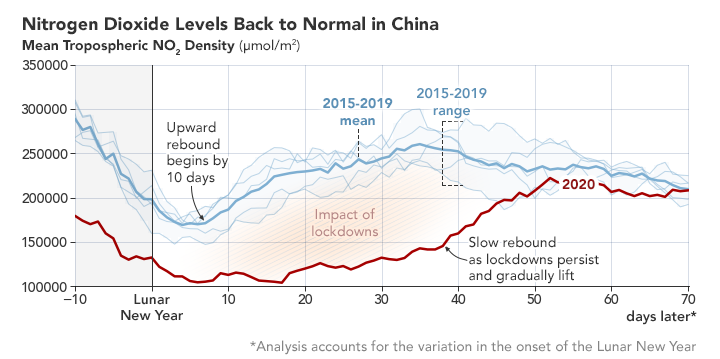
However, in 2020, that post-holiday rebound was delayed by several weeks because of the COVID-19 lockdown. In February and March 2020, NO2 levels over Wuhan and some other Chinese cities were well below long-term trends. By April, levels approached the long-term norm for the season.
It is important to note that NO2 levels in the atmosphere naturally decline each year from winter to spring and summer, apart from the Lunar New Year pattern. Increasing sunlight shortens the lifetime of the gas near the ground, and changing weather patterns can cause the pollutant to disperse more readily from the air.
Editor’s Note: For more information on NASA’s long-term measurements of nitrogen dioxide, see this page.
NASA Earth Observatory images by Joshua Stevens, using Ozone Monitoring Instrument (OMI) data from the NASA Goddard Earth Sciences Data and Information Services Center (GES DISC), and modified Copernicus Sentinel 5P data processed by the European Space Agency. Story by Michael Carlowicz.