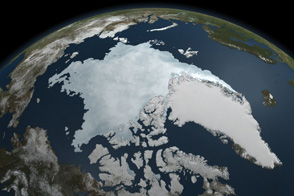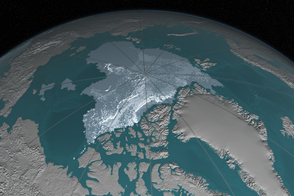
For the past two decades, satellites and scientists have revealed an ongoing, decades-long decline in Arctic sea ice, with implications for global ecosystems, weather, and climate. Satellites are now tracking what’s happening to the reflective, insulating layer of snow atop the ice.
The snow layer is an important component of the sea ice system, affecting how the ice grows and melts. In winter, blanket-like snow cover insulates sea ice from frigid polar air, slowing ice growth. In spring, snow cover must melt away before the ice surface can begin to melt. By summer, melt water from the snow collects in ponds atop the ice; this water absorbs heat from the Sun and can accelerate the warming and melting of the ice.
Over the years, scientists have collected ground and airborne surveys of snow depth here and there. But they need routine, widespread measurements to detect the detailed variations in snow depth across the ice cap and how it changes during the year. Those details are now measurable, as scientists have created the first satellite-based maps of snow accumulation on Arctic sea ice.
“This is the first time ever that we can get snow depth across the entire Arctic Ocean’s sea ice cover,” said Ron Kwok, a sea ice scientist at NASA’s Jet Propulsion Laboratory and author of a study in JGR Oceans. “The Arctic region is a desert—but what snow we do get is very important in terms of the climate and insulating sea ice.”
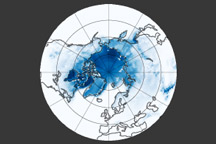
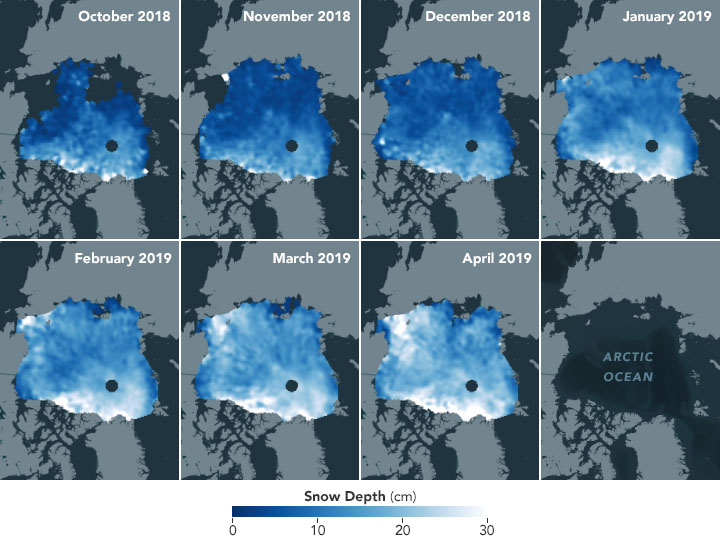
The maps above show snow depths across Arctic sea ice, averaged monthly from October 2018 through April 2019. Snow starts building up slowly in October, when newly formed ice has an average of about 5 centimeters (2 inches) of snow on it and multiyear ice has an average of 14 centimeters (5.5 inches). Snowfall picks up in December and January and reaches its maximum depth in April, when the relatively new ice has an average of 17 cm (6.7 in) of snow cover and the older ice has an average of 27 cm (10.6 inches).
To produce the maps, scientists compared elevation measurements from two satellites. NASA’s Ice, Cloud and land Elevation Satellite-2 (ICESat-2) carries a laser altimeter, which uses pulses of light to precisely measure the height of the first substance it hits—whether that’s open water, bare sea ice, or snow that has accumulated on top of the ice. The European Space Agency’s CryoSat-2 satellite carries a radar altimeter; in contrast to lidar, the radio waves of radar mostly pass through snow and reflect off the top of the ice. By calculating the difference between these two measurements, scientists can estimate the depth of the snow layer on top.
“The method is certainly the best approach to-date,” Kwok said. “With ICESat-2 and CryoSat-2, we are able to obtain a time-variable estimate of the snow depth from observations, without resorting to models.”
With additional years of observations, maps like these could help scientists assess how climate change affects precipitation and the accumulation of snow. The challenge, Kwok notes, is that the measurement relies on having both satellites in orbit at the same time. ICESat-2 is newer, having launched in 2018, while CryoSat-2 has already been in orbit for a decade.
“If we lose CryoSat-2, then we are back to doing this with ICESat-2 alone,” Kwok said. “The hope is that we’ll be able to have a least a few years to make progress toward improving models.”
NASA Earth Observatory images by Joshua Stevens, using data courtesy of Kwok, R., et al. (2020). Story by Kathryn Hansen, with reporting from Kate Ramsayer.