Three weeks into November 2019, springtime bush fires continued to blaze across southern and eastern Australian states. As of November 20, government agencies counted 45 fires in South Australia and 49 in New South Wales, and dangerously dry and windy weather was fanning flames in Victoria and Queensland.
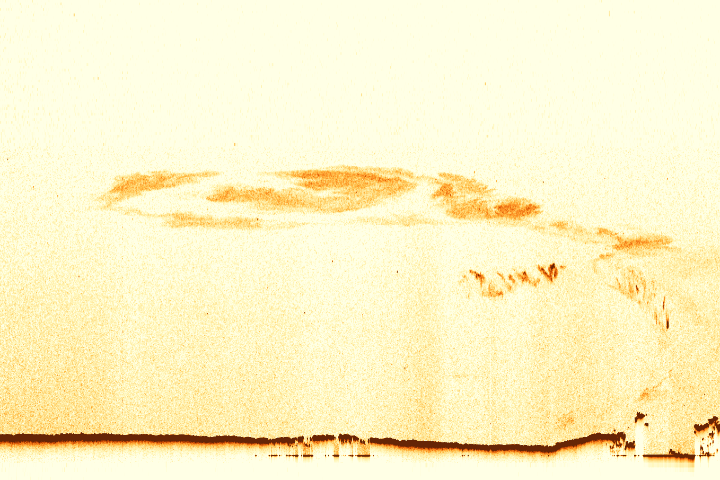
The fires have sent smoke rising high into the atmosphere and half-way around the world, with satellites detecting aerosols and other smoky pollutants crossing the Pacific and moving over the South Atlantic Ocean. Locally, the smoke has blanketed the Sydney metropolitan area, significantly degrading air quality.
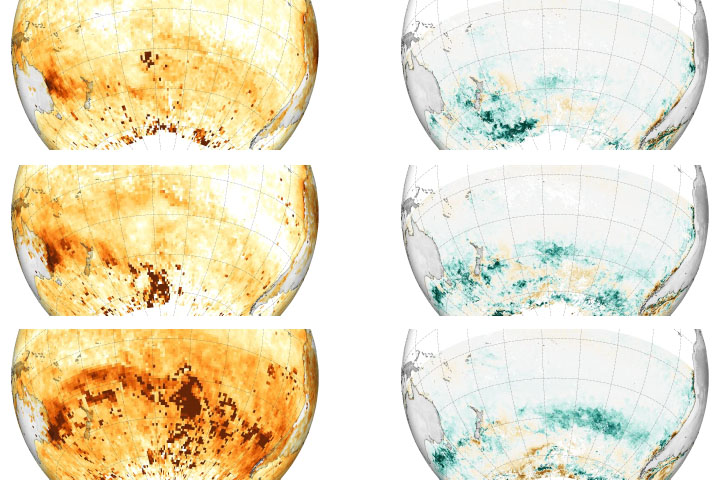
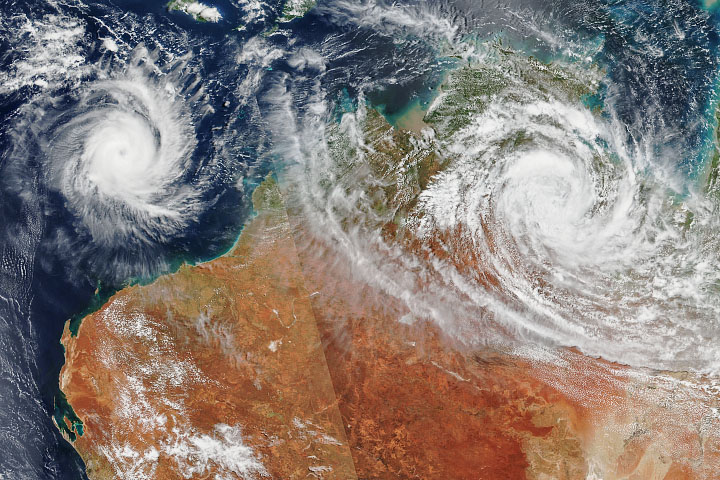
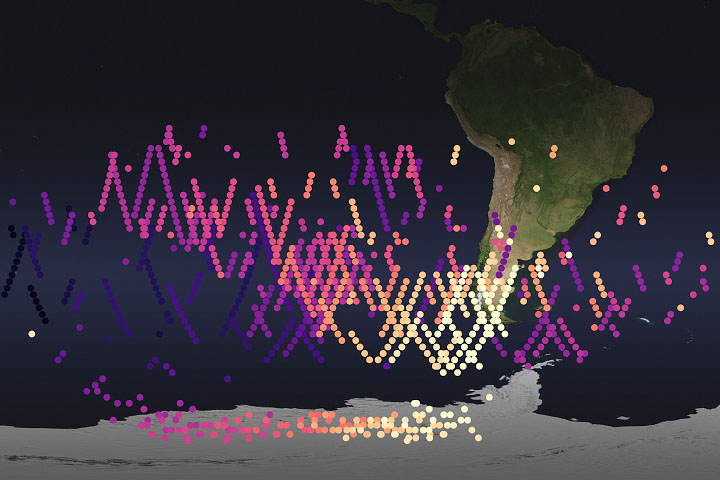
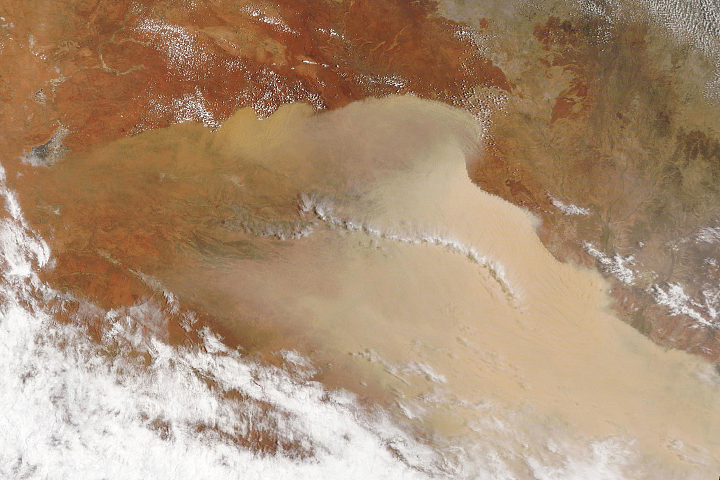
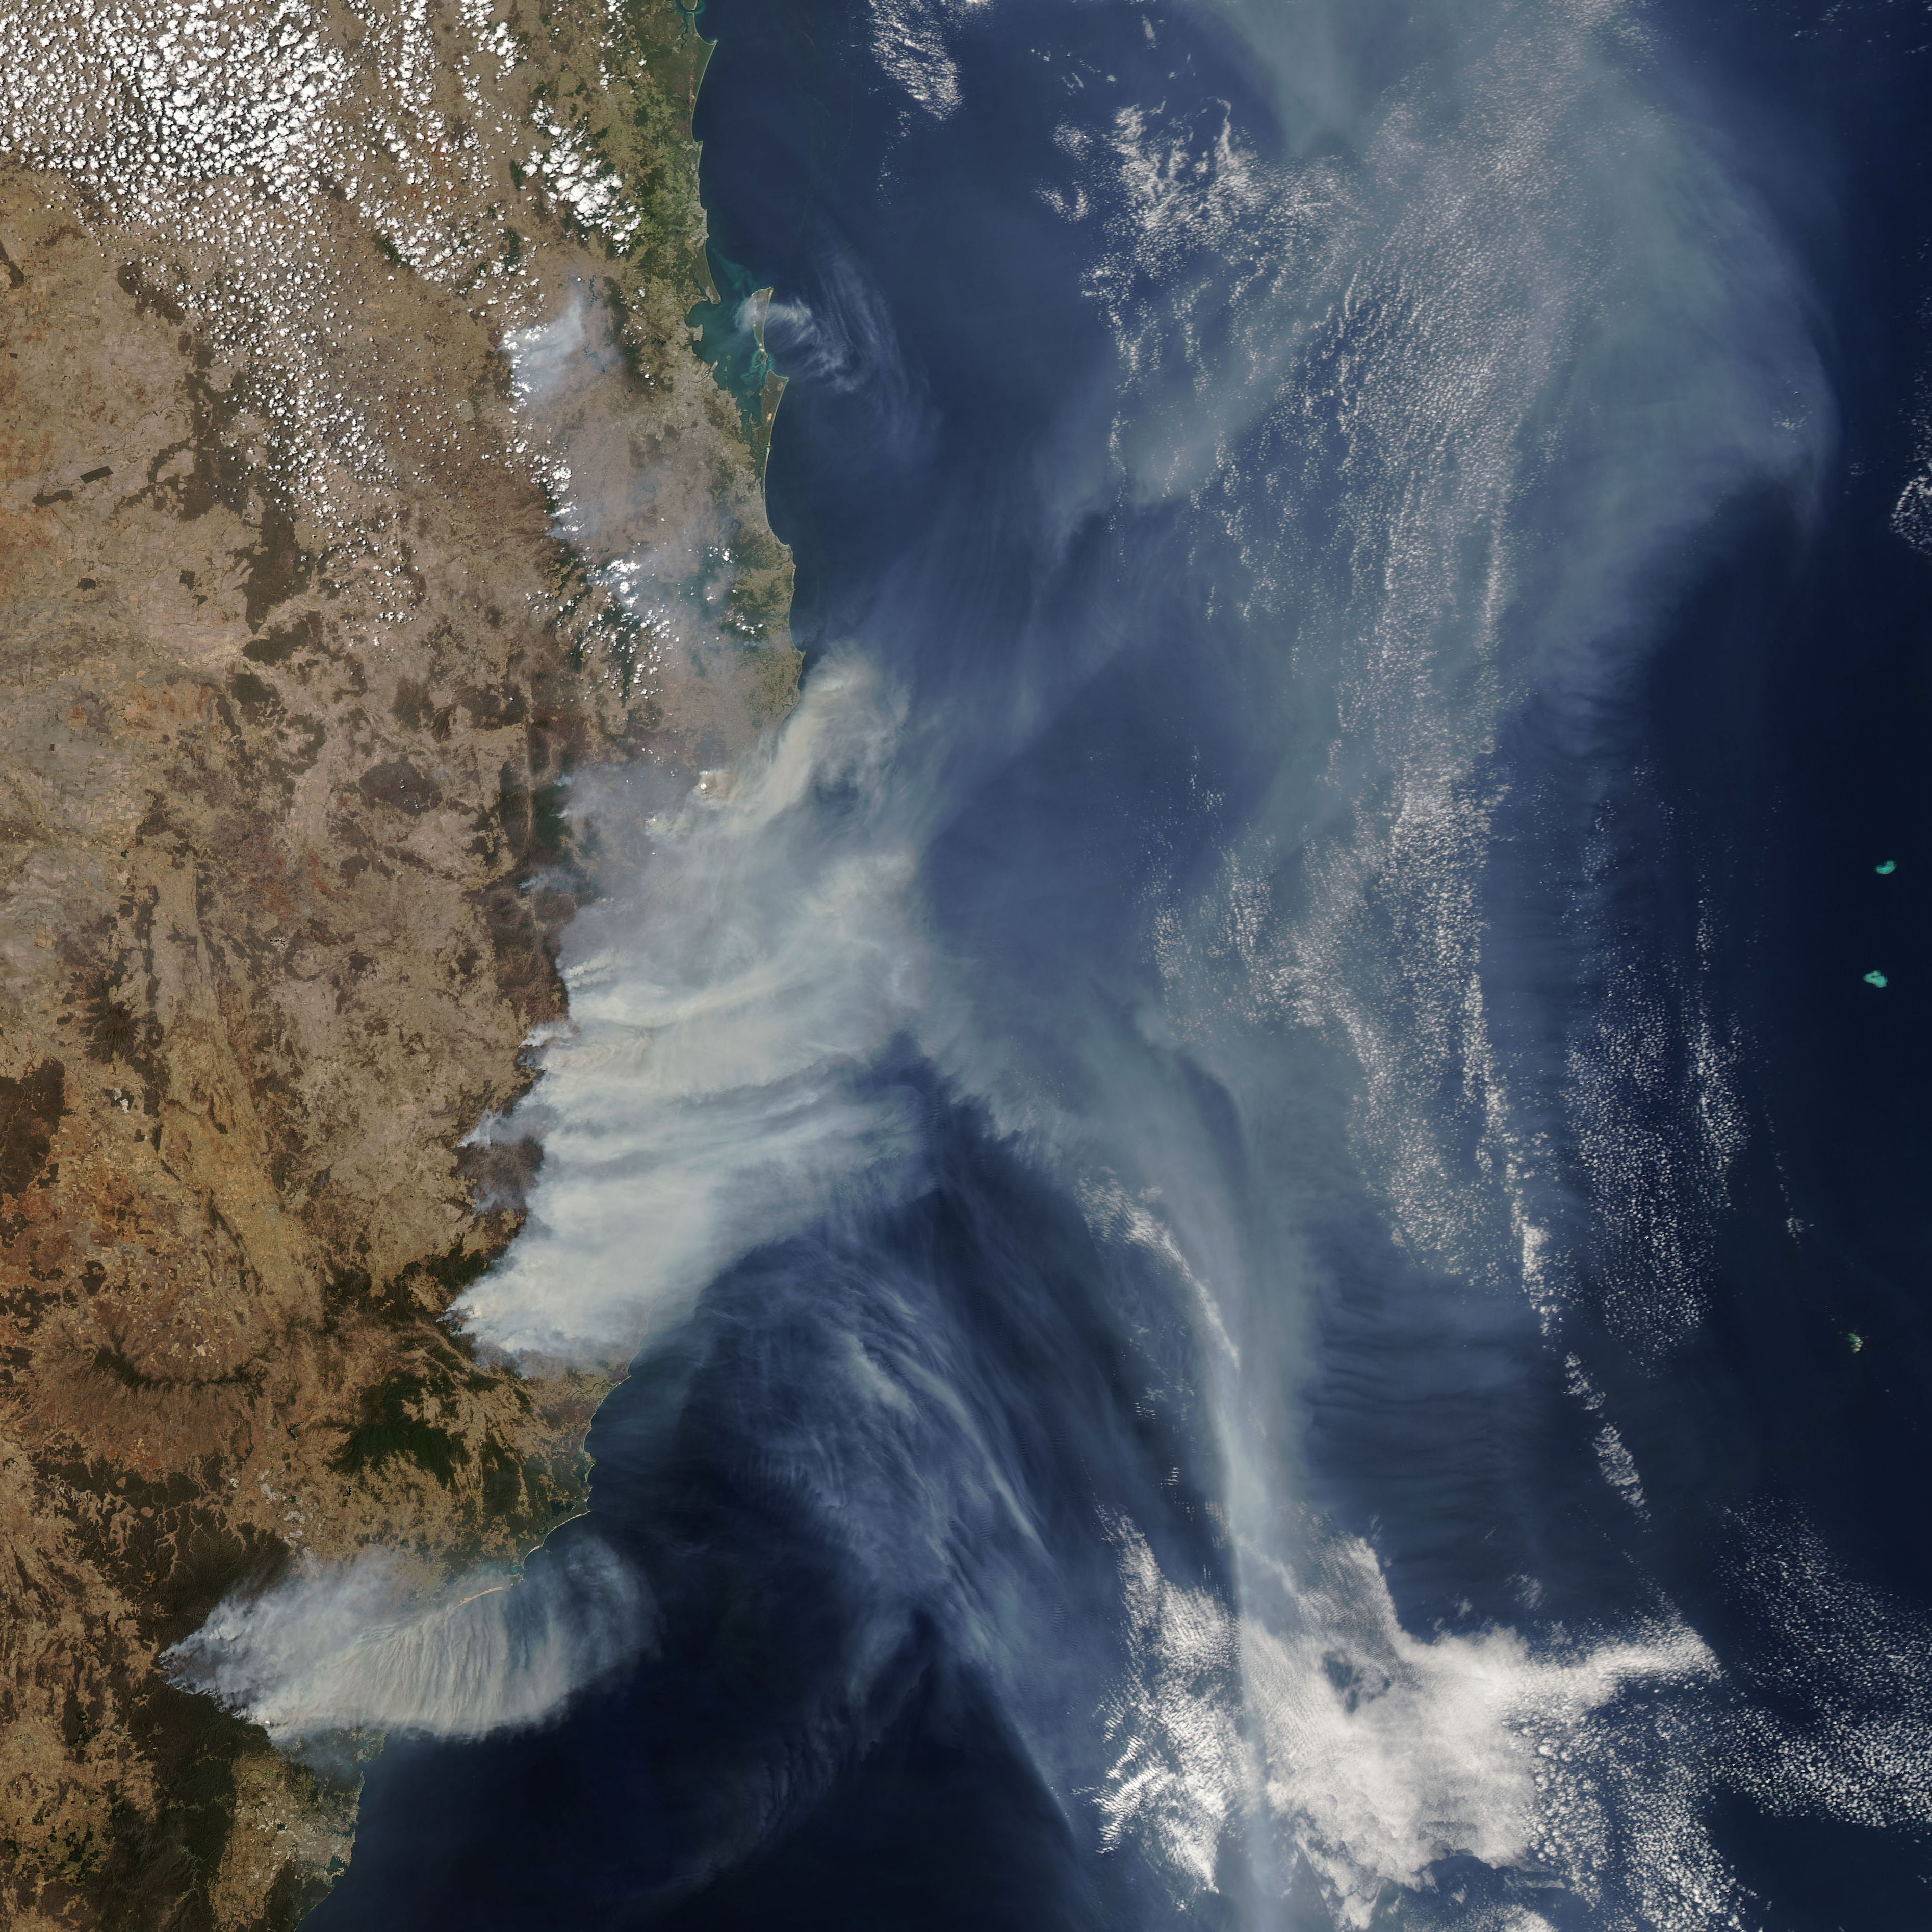
On November 19, 2019, the Moderate Resolution Imaging Spectroradiometer (MODIS) on NASA’s Aqua satellite acquired a natural-color image (above) of thick smoke plumes rising from New South Wales (NSW) and Queensland. The animation below depicts the abundance and direction of black carbon blowing through the atmosphere from November 1-18.
The data for the animation come from the GEOS forward processing (GEOS-FP) model, which assimilates information from satellite, aircraft, and ground-based observing systems. Like other weather and climate models, GEOS FP uses mathematical equations that represent physical processes to calculate what is happening in the atmosphere. The model calculates the position and concentration of black carbon plumes every three hours. To simulate black carbon, modelers make use of satellite observations of aerosols and fires. GEOS-FP also ingests meteorological data like air temperature, moisture, and winds to project the plume’s behavior.
According to researchers, the smoke plumes from the Australian fires have risen as high as 12 to 13 kilometers (7 to 8 miles) in the atmosphere. That is unusually high for wildfires. “This event is interesting because we still don’t have a confirmed pyrocumulonimbus cloud to explain the lofting,” said Mike Fromm, a fire researcher at the U.S. Naval Research Laboratory. “In spite of this being a well-observed plume event, it is still not clear how so much smoke got so high so fast.”
As wildfires consume wood, vegetation, homes, and other materials, they emit many gases and particles, including carbon monoxide, carbon dioxide, hydrocarbons, nitrogen oxides, organic carbon, and fine particulate matter (PM2.5). Black carbon is a type of aerosol that is especially harmful to humans and animals because the particles are small enough to enter the lungs and bloodstream.
When such pollutants rise high into the atmosphere, their effects can spread across oceans and continents and can linger for weeks to months. Beyond health effects on the ground, black carbon and other debris can darken snow and ice, accelerating melting. In the atmosphere, the particles and gases can absorb or block sunlight, affect cloud formation, and increase or reduce rainfall. When lofted in great quantities, smoke plumes might have an impact on climate.
“Events like these are like natural experiments to study atmospheric air mass movements,” said Santiago Gasso of NASA’s Goddard Space Flight Center. “Like a volcanic eruption, there is so much material in these smoke plumes that you can track the air for thousands of kilometers. It is like releasing a tracer and following where it goes over the South Pacific, an area that is notoriously under-observed.”
Occasionally, smoke even causes odd problems for pilots. “Dense smoke far from its source can create problems, especially if it is encountered without knowing what it is,” said Fromm. “For instance, airliners have occasionally made emergency landings because smoke outside was detected inside the aircraft.”
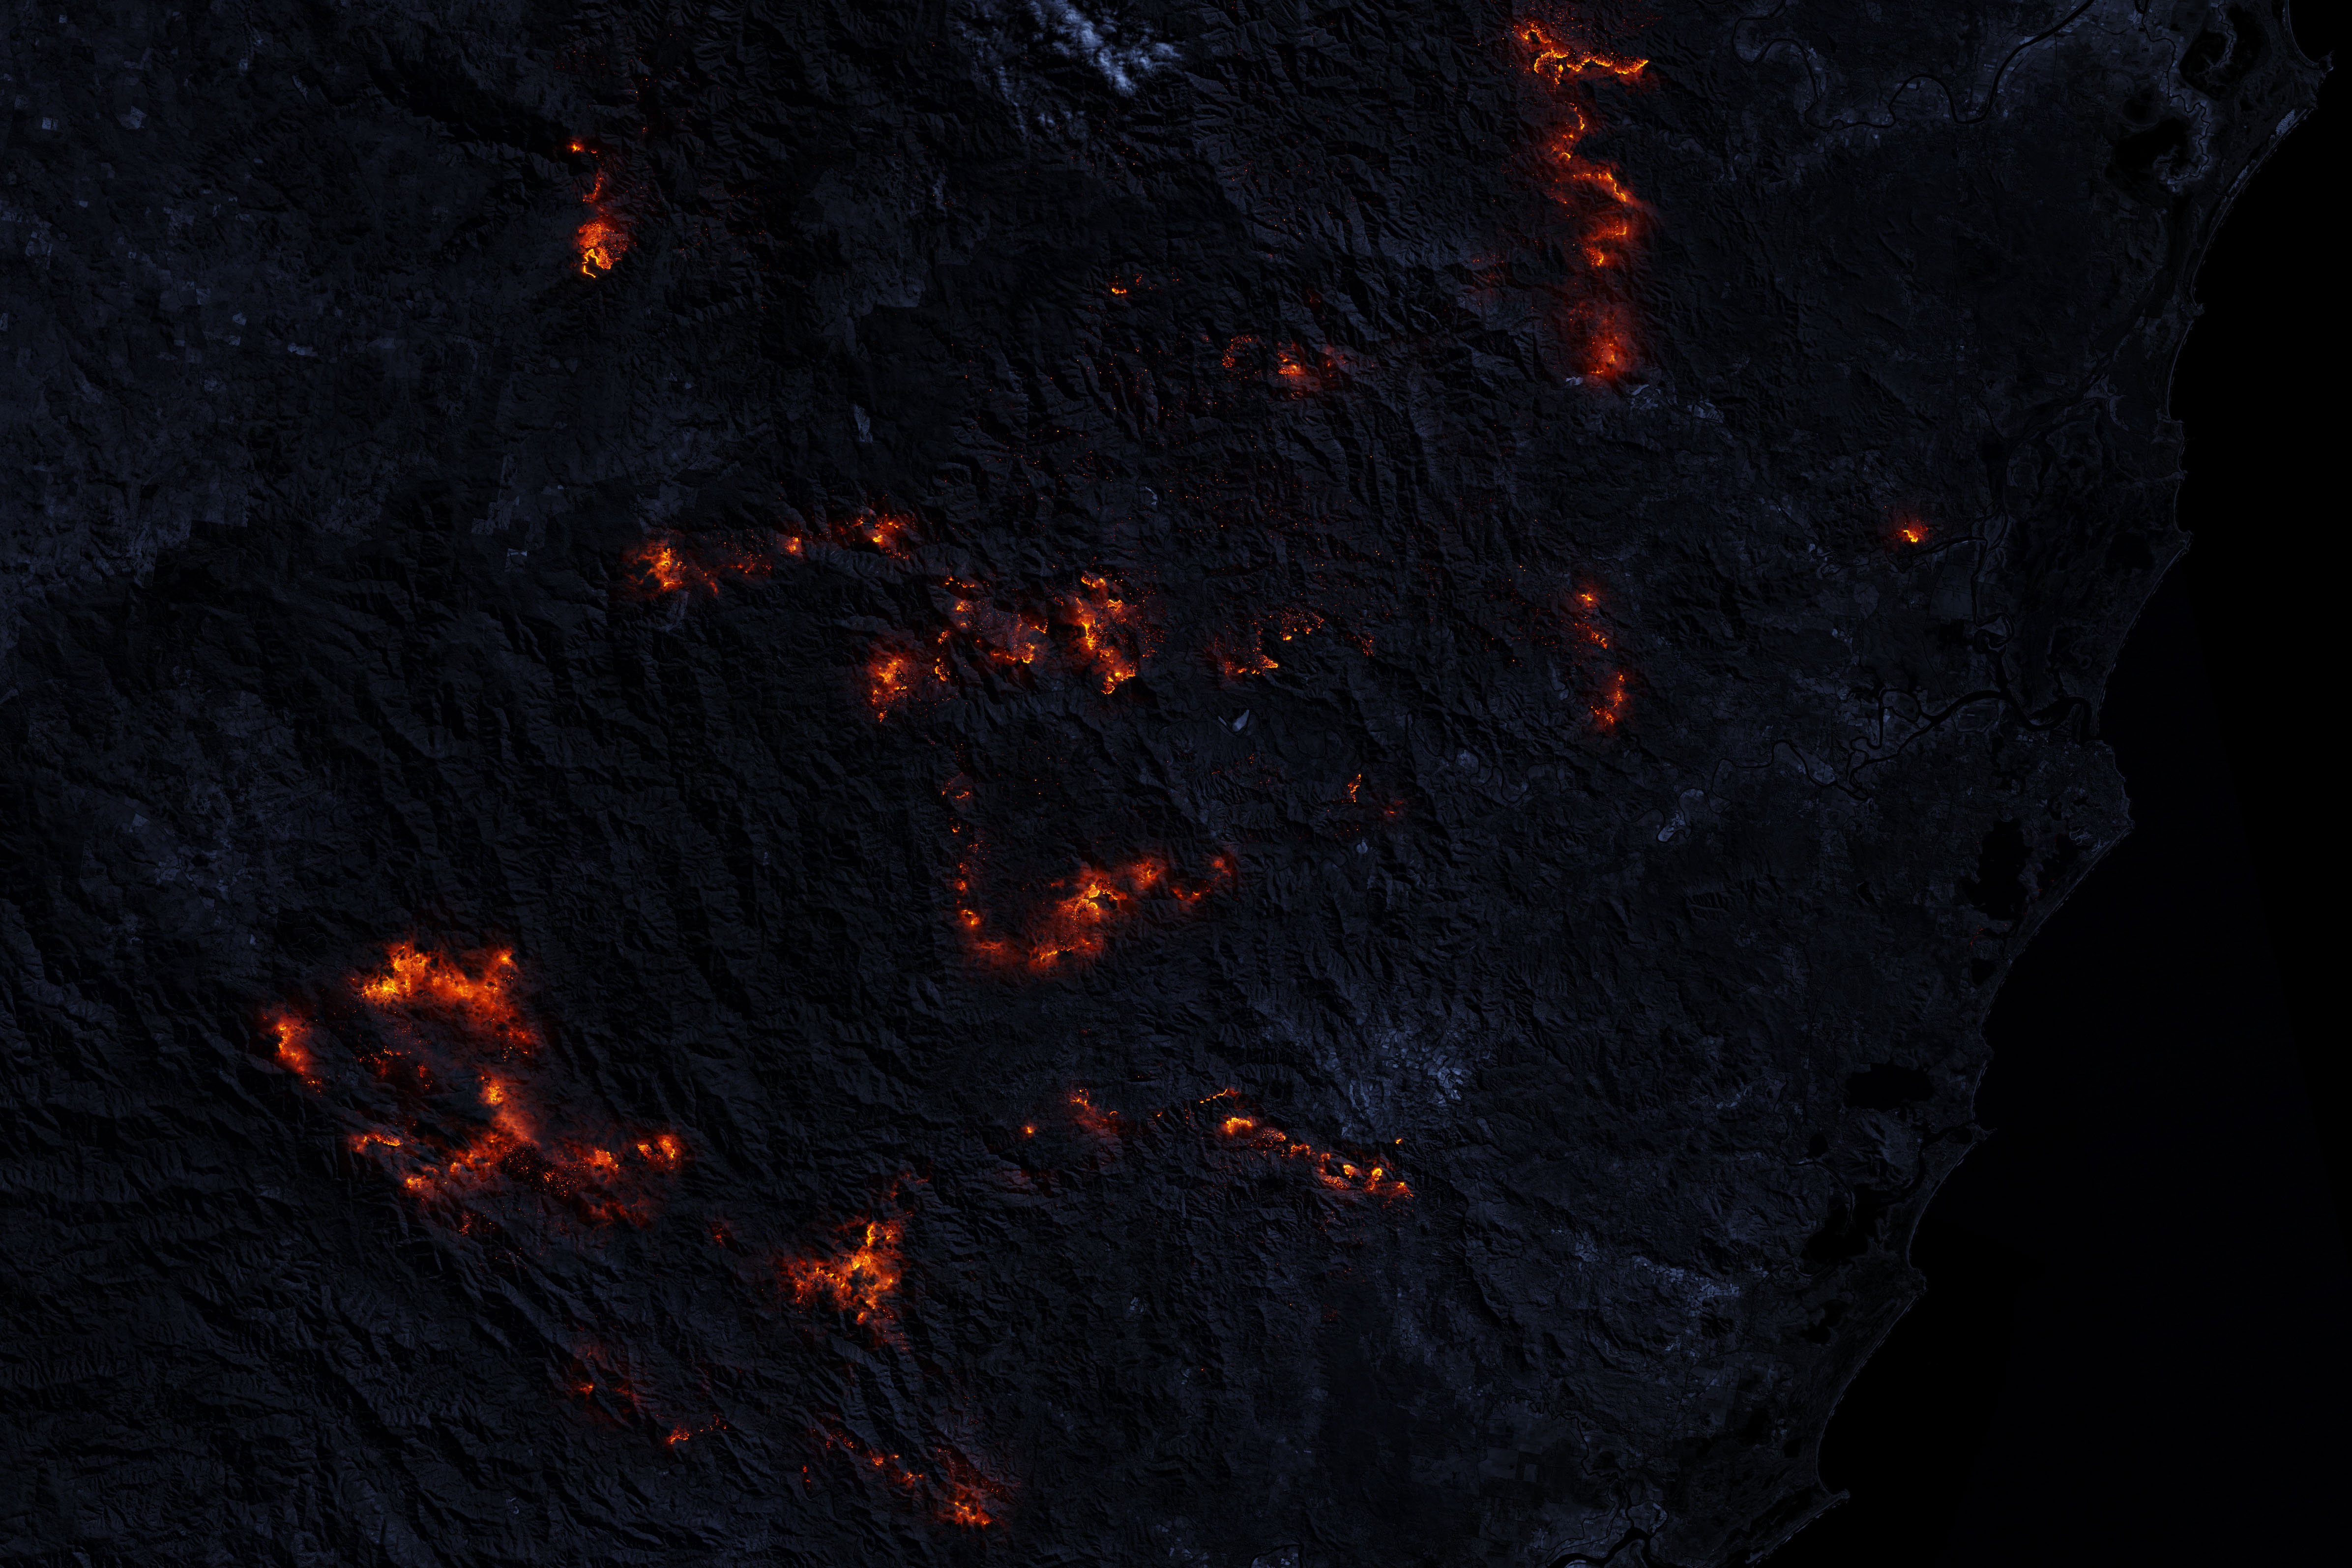
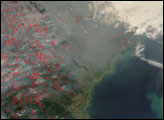
At 12:25 Universal Time (11:25 p.m. local time) on November 17, the Operational Land Imager on Landsat 8 acquired this nighttime image of fires raging near Port Macquarie, New South Wales. The image was made from a combination of shortwave and near-infrared data (bands 7-6-5) to reveal hot spots through the smoke and clouds. The infrared data is overlaid on a base map created with imagery from before the fires began.
NASA Earth Observatory images and video by Joshua Stevens, using GEOS-5 data from the Global Modeling and Assimilation Office at NASA GSFC, MODIS data from NASA EOSDIS/LANCE and GIBS/Worldview, and Landsat data from the U.S. Geological Survey. Story by Michael Carlowicz and Adam Voiland.