Images bridging four decades show where Switzerland’s largest glacier and its neighbors have been losing ice.
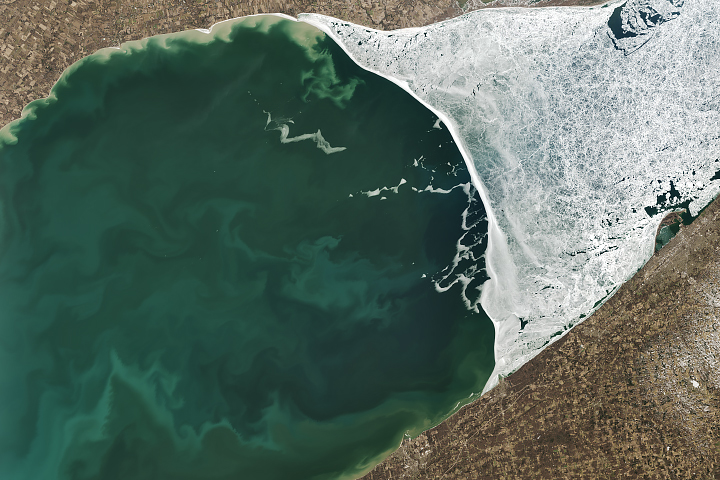
As winter turned to spring, ice cover on the lake diminished to reveal colorful billows of sediment and phytoplankton.
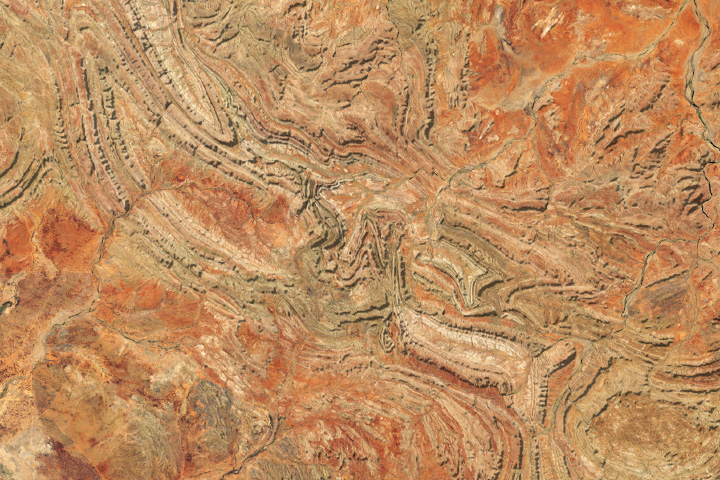
The asteroid that smashed into northern Australia and caused the Amelia Creek impact structure transformed mountain ridges in the blast zone.
Published Mar 20, 2025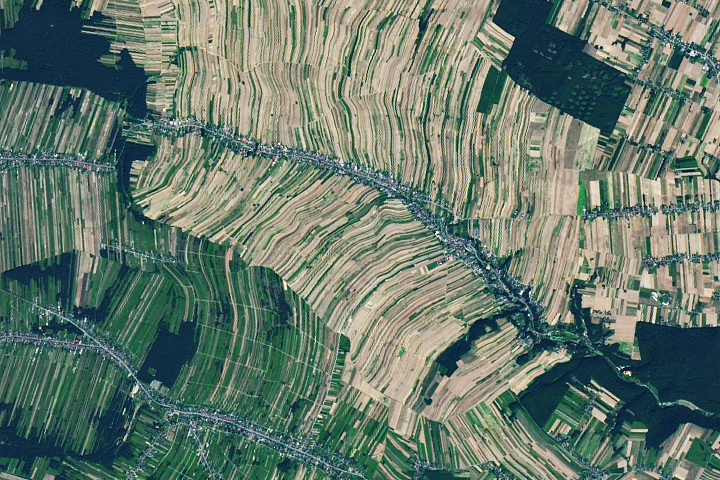
Repeated land divisions over centuries have created a complex mosaic of ribbon-like fields in southern Poland.
Published Mar 19, 2025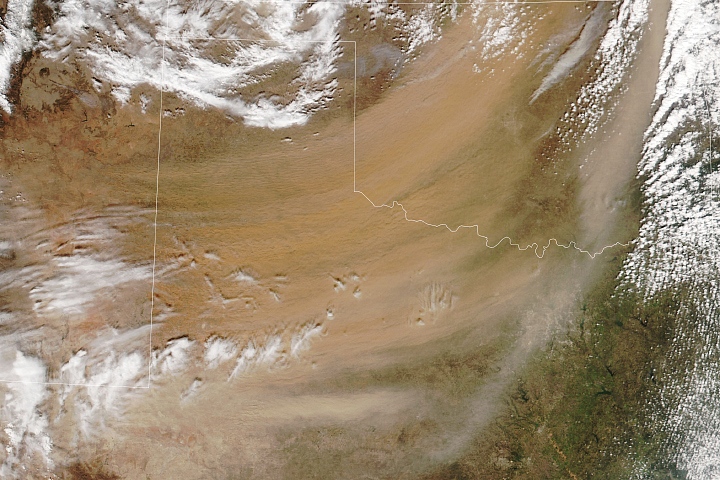
A major weather system spawned wind-fueled fires and dust storms in the state before moving east.
Published Mar 17, 2025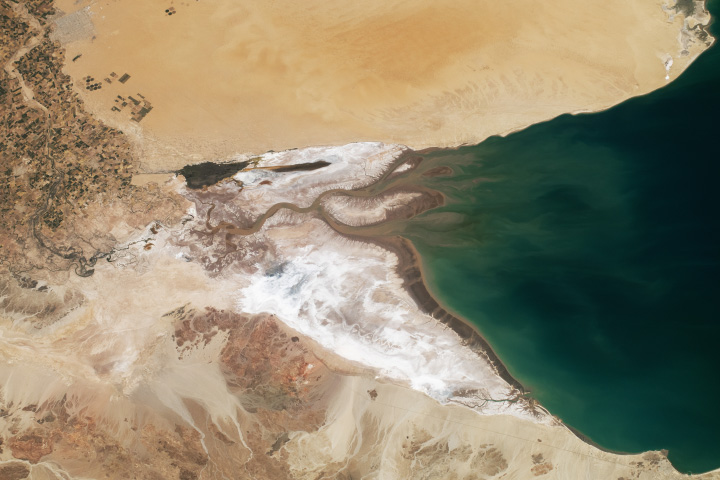
A salt-encrusted landscape surrounds the Colorado River where it once emptied into the Gulf of California.
Published Mar 16, 2025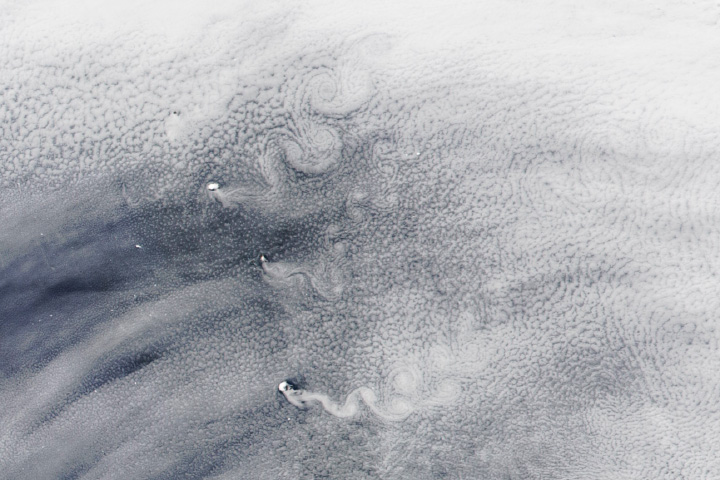
The remote South Sandwich Islands can disrupt passing clouds in ways that shed alternating rows of cloud spirals.
Published Mar 15, 2025
Torrential rains set off dangerous flash flooding in the Argentinian port city.
Published Mar 14, 2025Image of the Day Atmosphere Water Drought Fires Floods Severe Storms Human Presence Temperature Extremes
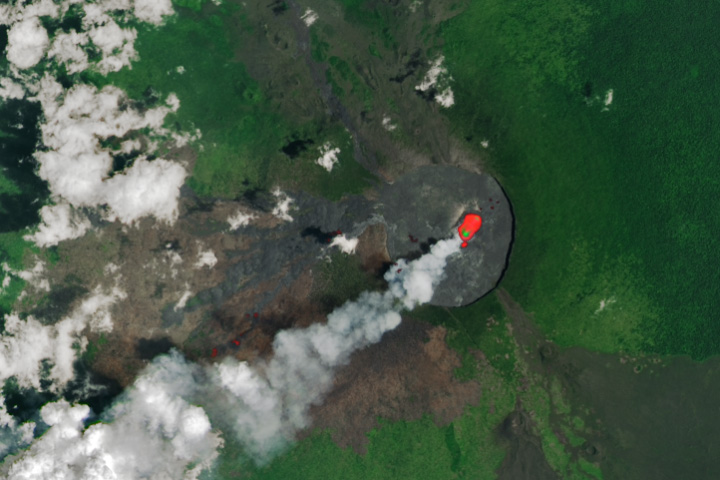
Clouds parted to reveal fresh lava flows on the slopes of the East African Rift volcano.
Published Mar 12, 2025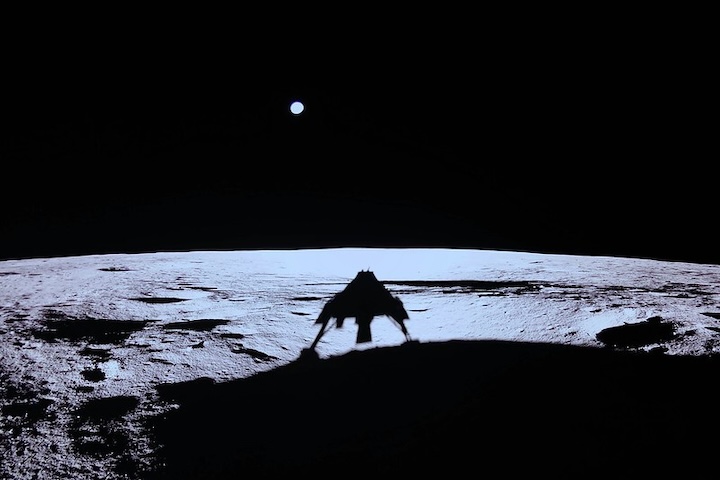
A digital camera on the Blue Ghost lander looked back at Earth and captured this ethereal image.
Published Mar 12, 2025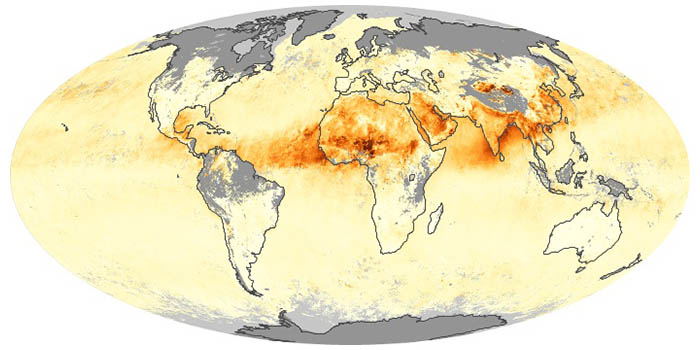
Airborne aerosols can cause or prevent cloud formation and harm human health. These maps depict aerosol concentrations in the air based on how the tiny particles reflect or absorb visible and infrared light.
What do you do when presented with a new satellite image? Here's what the Earth Observatory team does to understand the view.
Published Nov 18, 2013
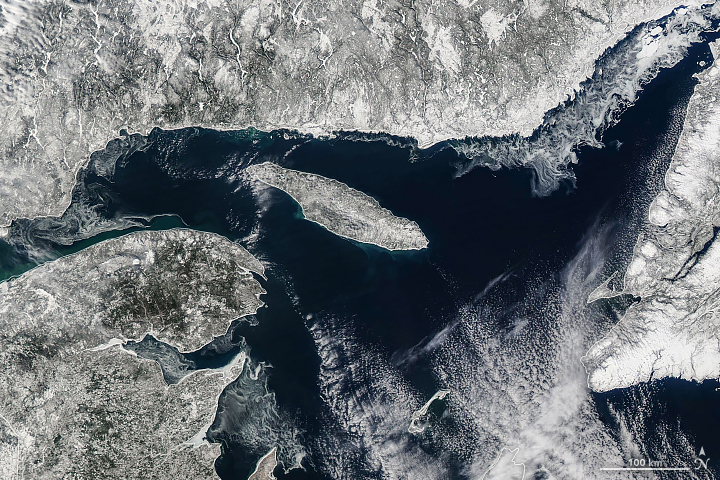
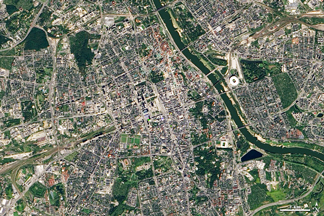
Your challenge is to tell us the location of the satellite image and why it is interesting.
Published Mar 11, 2025
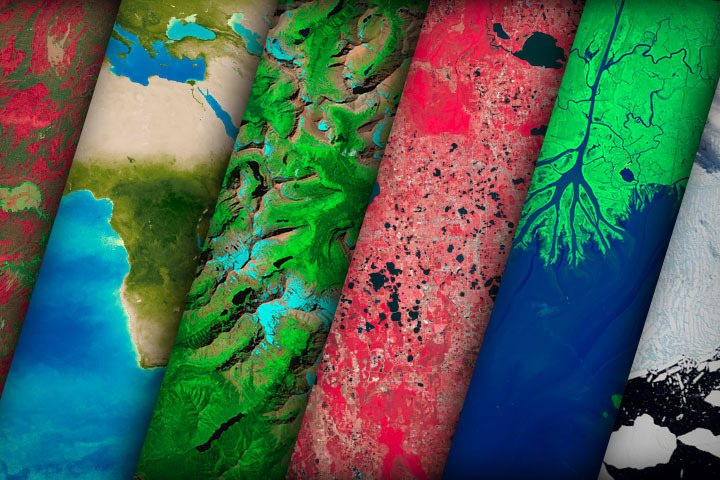
NASA satellites document how our world—forests, oceans, human landscapes, even the Sun—changes over months, seasons, and years.
Published Apr 29, 2009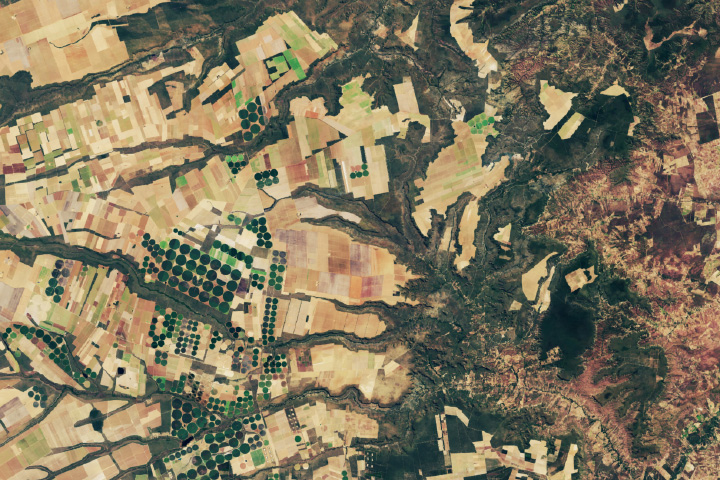
Using NASA data, researchers can track vegetation changes around the planet, not just in forests but also in grasslands and savannas like the Brazilian Cerrado.
Published Mar 11, 2025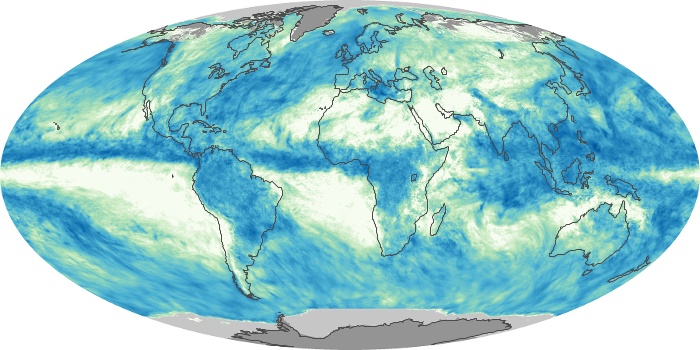
These maps depict monthly total rainfall around the world. Rainfall is the primary source of fresh water for humans, plants, and animals. Rain also moves heat between the atmosphere, oceans, and land.
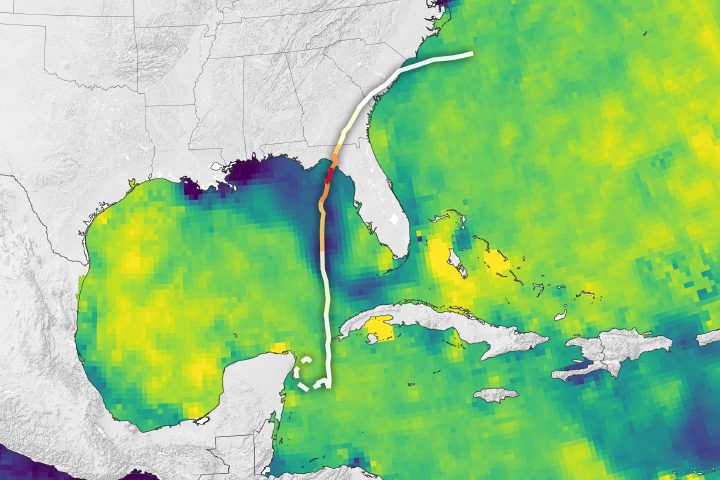
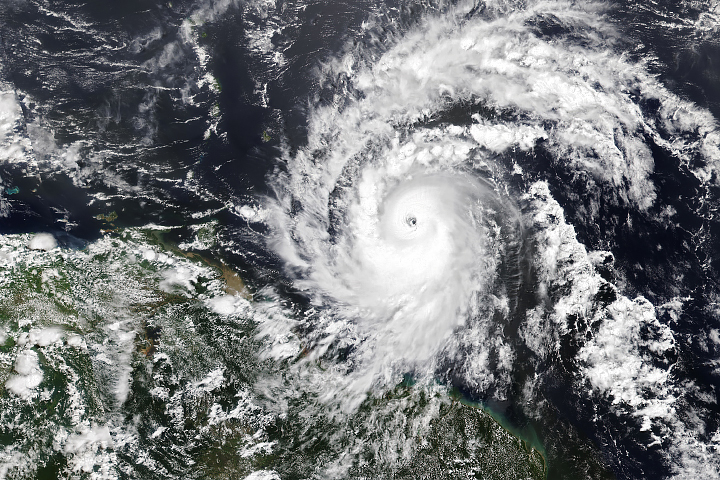
A new analysis suggests that a large freshwater plume in the hurricane’s path helped fuel its extraordinary growth.
Published Mar 10, 2025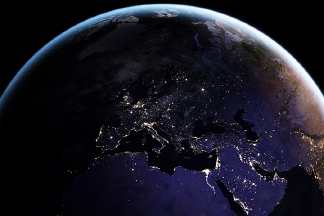
Satellite images of Earth at night have been a curiosity for the public and a tool of fundamental research for at least 25 years. They have provided a broad, beautiful picture, showing how humans have shaped the planet and lit up the darkness.
Published Apr 12, 2017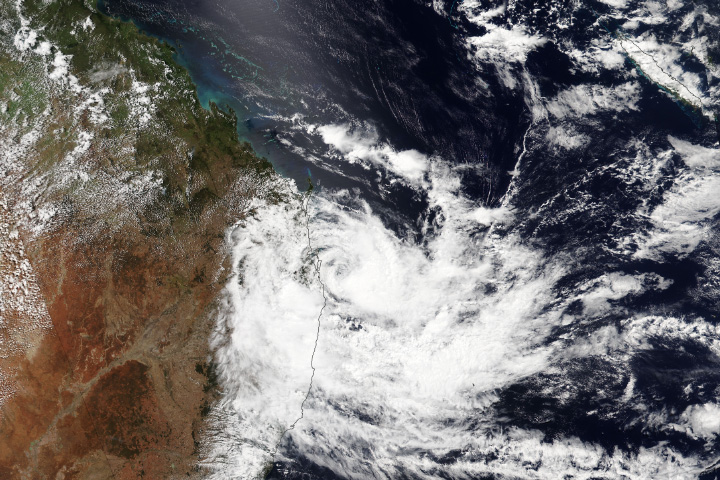
The tropical cyclone took a sharp turn toward Australia’s east coast, bringing flooding and other hazards to an area that rarely sees this type of storm.
Published Mar 7, 2025Image of the Day Drought Fires Floods Severe Storms Human Presence Temperature Extremes
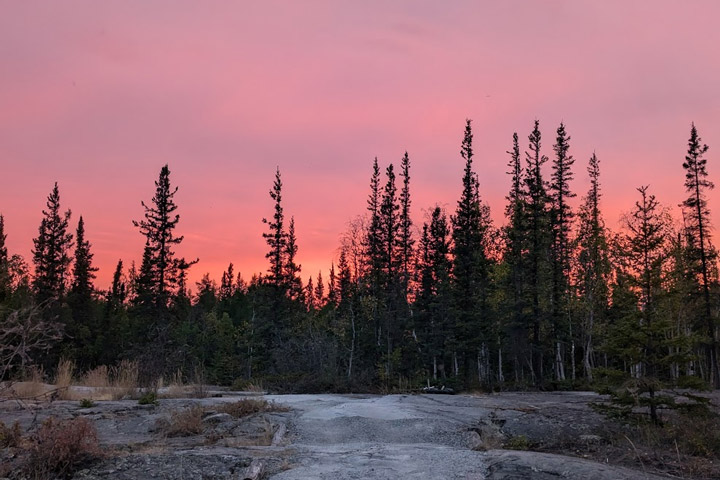
"Leaf-to-orbit" activities began as the campers arrived in Canada’s Northwest Territories.
Published Mar 4, 2025
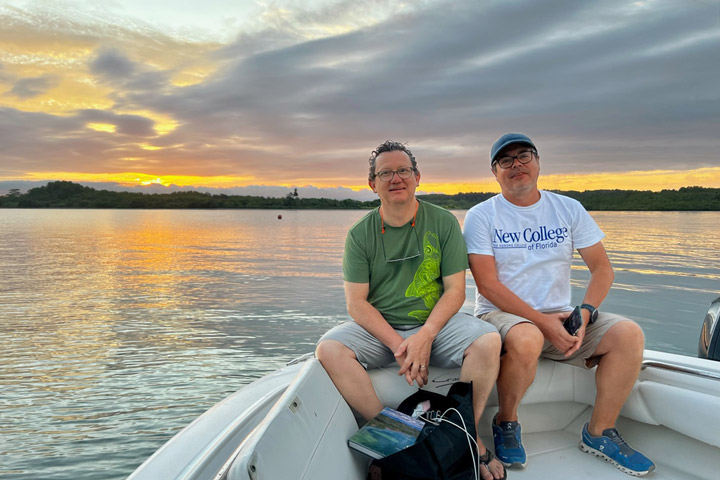
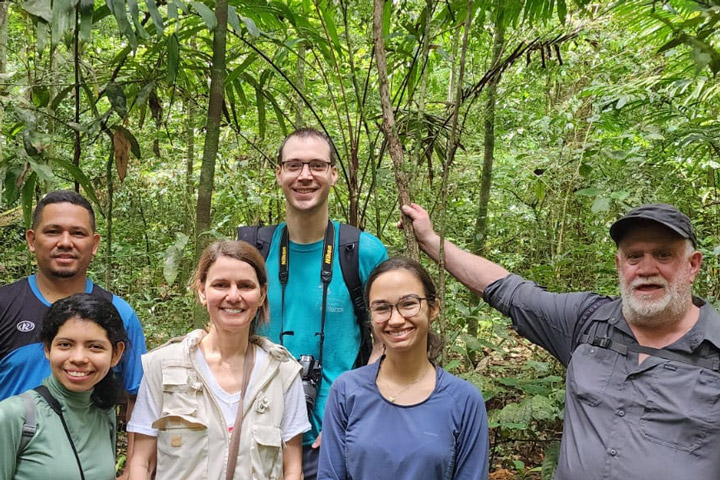
After 31 years, scientist Joaquin Chaves returned to the Pacific coast of Costa Rica for another international expedition.
Published Feb 27, 2025
A new camp in Canada’s Northwest Territories would allow youth to view wetland environments from a ‘leaf-to-orbit’ perspective.
Published Feb 25, 2025

Your challenge is to tell us the location of the satellite image and why it is interesting.
Published Feb 25, 2025

AVUELO's many moving parts has made time fly by by for the campaign’s project scientist.
Published Feb 21, 2025
What does AVUELO have in common with a Joni Mitchell song? The answer lies in the clouds.
Published Feb 19, 2025
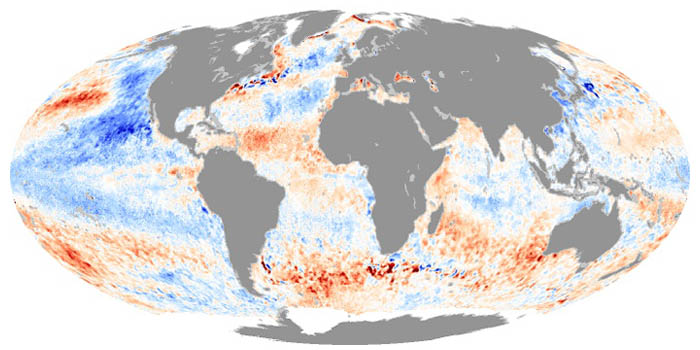
These maps depict how much hotter or cooler an ocean basin was compared to the long-term average. Temperature anomalies can indicate changes in ocean circulation or the arrival of patterns like El Niño and La Niña.
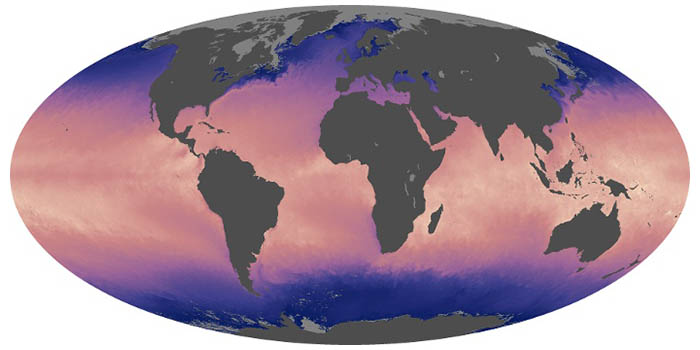
Ocean temperatures can influence weather, such as hurricane formation, and climate patterns, such as El Niño. These maps show the temperature at the surface of the world’s seas and oceans.
Hurricane season in the basin runs from June 1 to November 30.
Published Jul 1, 2024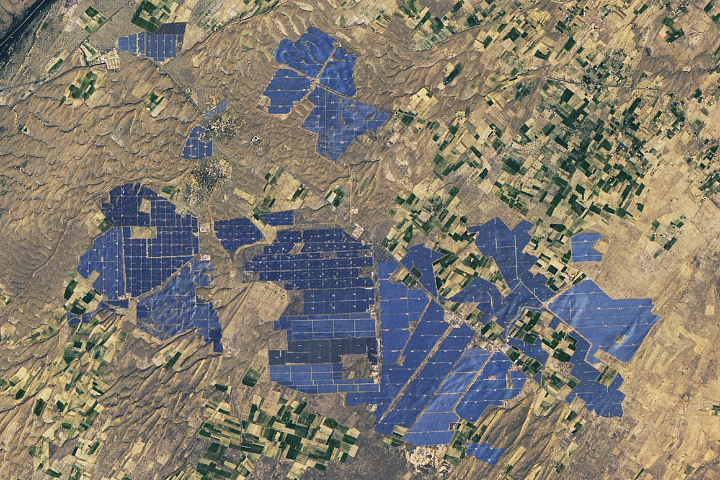
People have developed systems to harvest and store energy from sources such as wind, sunlight, and tidal action. Many of these installations are visible from orbit.
Published May 10, 2024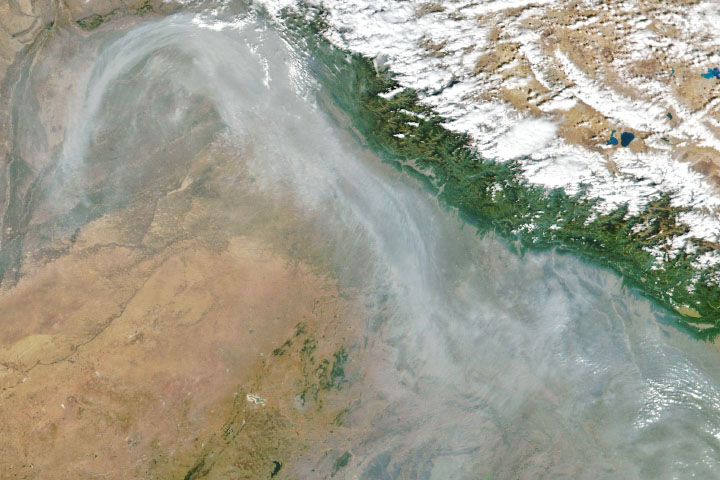
From ground-level ozone to particulate matter to nitrogen dioxide, an array of gasses and particles can affect the air people breathe, with implications for human health.
Published Apr 8, 2024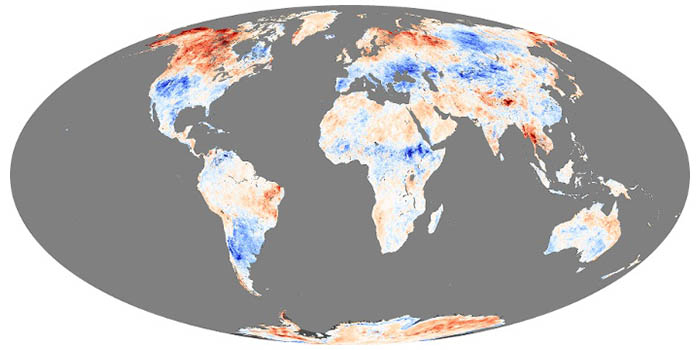
These maps depict anomalies in land surface temperatures (LSTs); that is, how much hotter or cooler a region was compared to the long-term average. LST anomalies can indicate heat waves or cold spells.
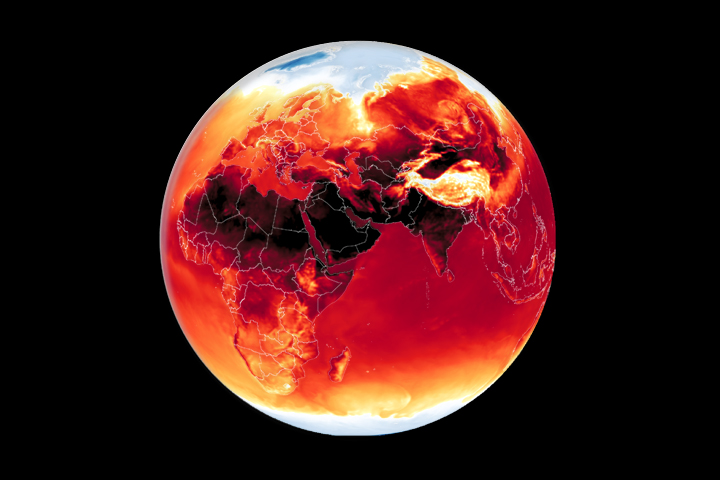
Warmer-than-average temperatures are showing up locally and globally, with consequences for people, landscapes, and ecosystems.
Published Mar 26, 2024
12 months of high-resolution global true color satellite imagery.
Published Oct 13, 2005
Whether sparked by lightning, intentional land-clearing, or human-caused accidents, wildland fires are burning longer and more often in some areas as the world warms.
Published Feb 27, 2024Have you ever wondered what it would be like to live in a different part of the world? What would the weather be like? What kinds of animals would you see? Which plants live there? By investigating these questions, you are learning about biomes.
Published Aug 28, 2020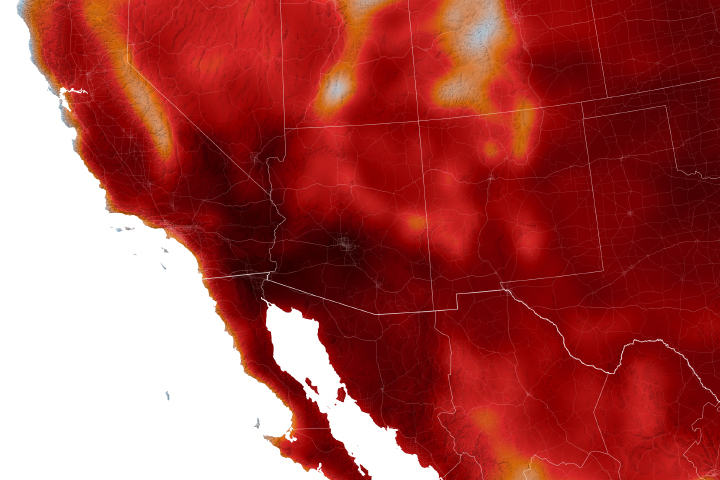
Warmer-than-average temperatures are showing up locally and globally, with consequences for people, landscapes, and ecosystems.
Published Aug 15, 2023alert message