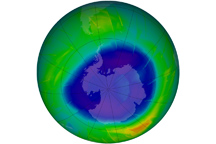
Blues and purples in this image of Antarctic ozone concentrations reveal the developing ozone hole of 2009.
Published Sep 17, 2009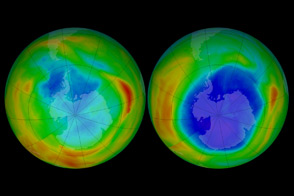
NASA satellites have observed the Antarctic ozone hole since the late 1970s—before and after nations agreed to stop producing chemicals that destroy the ozone layer.
Published Sep 18, 2012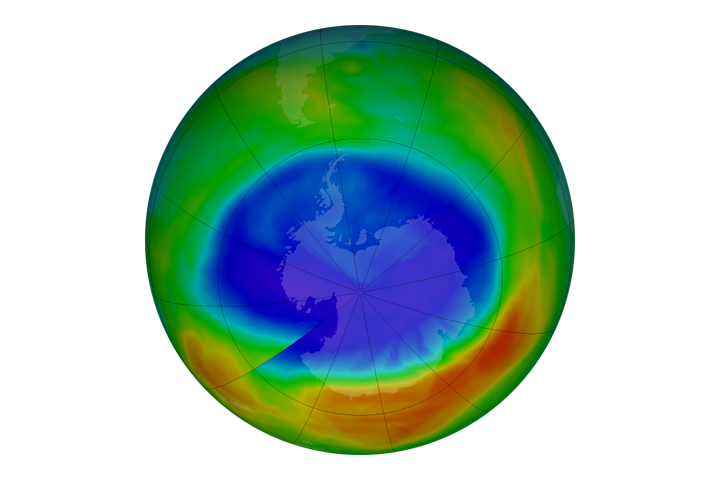
The smaller ozone hole was strongly influenced by an unstable and warmer-than-usual Antarctic vortex.
Published Nov 3, 2017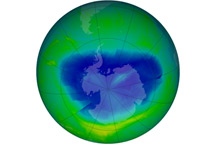
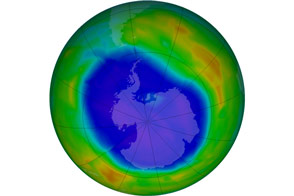
The Ozone Monitoring Instrument (OMI) on NASA’s Aura satellite acquired data for this map of ozone concentrations over Antarctica on September 12, 2010.
Published Sep 16, 2010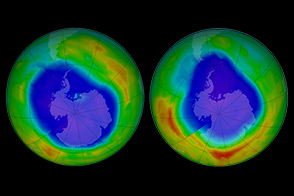
Does a smaller hole mean that Antarctic ozone is recovering? Not yet, say NASA scientists. A deeper look at the ozone hole shows that for now weather still has a bigger influence on the size of the ozone hole than policies that limited emissions of ozone-destroying chemicals.
Published Dec 19, 2013
Ozone depletion was significantly worse than in 2019, but better than in the early 2000s.
Published Nov 2, 2020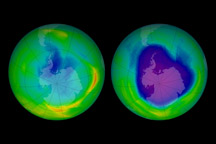
In 1979, Antarctic ozone levels dropped below 200 Dobson Units for the first time on record. This threshold became the standard for defining the ozone hole. In 2008, minimum ozone levels dropped to 100 Dobson Units on October 4.
Published Jun 2, 2009
The same international agreement that successfully put the ozone layer on the road to recovery is now being used to address climate change.
Published Oct 27, 2016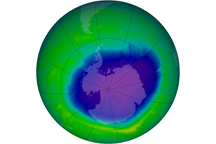
This series of images shows the Antarctic ozone hole on the day of its maximum depletion in 1979, 1987, 2006, and 2010; that is, the days with the thinnest ozone layer.
Published Feb 1, 2011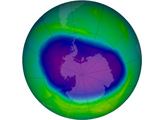
The annual ozone hole over Antarctica reached its maximum area on September 12, 2011, and its maximum depth on October 9, 2011.
Published Oct 21, 2011alert message
