The Earth Observatory has published its last Image of the Day on this website. Please join us on our new home at science.nasa.gov/earth/earth-observatory.
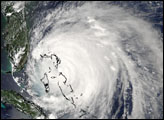
Having churned through the Atlantic for two weeks, Hurricane Florence is among the longest-lived cyclones of the 2018 season. That means the storm’s winds have had plenty of time to rage and ease as they ran into different environmental conditions over the Atlantic Ocean.
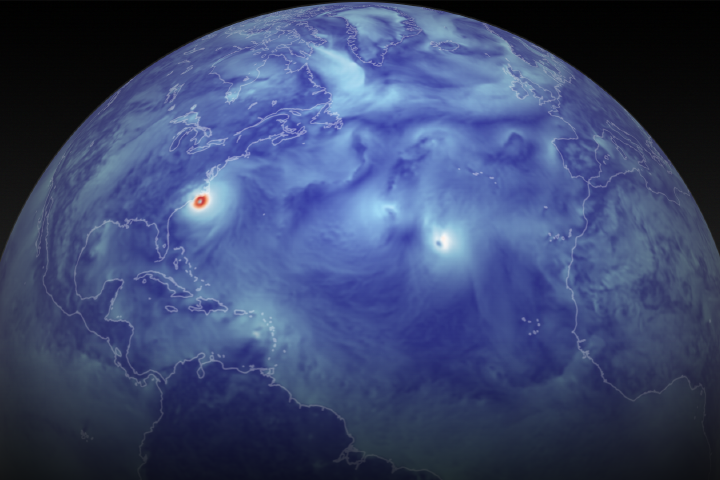
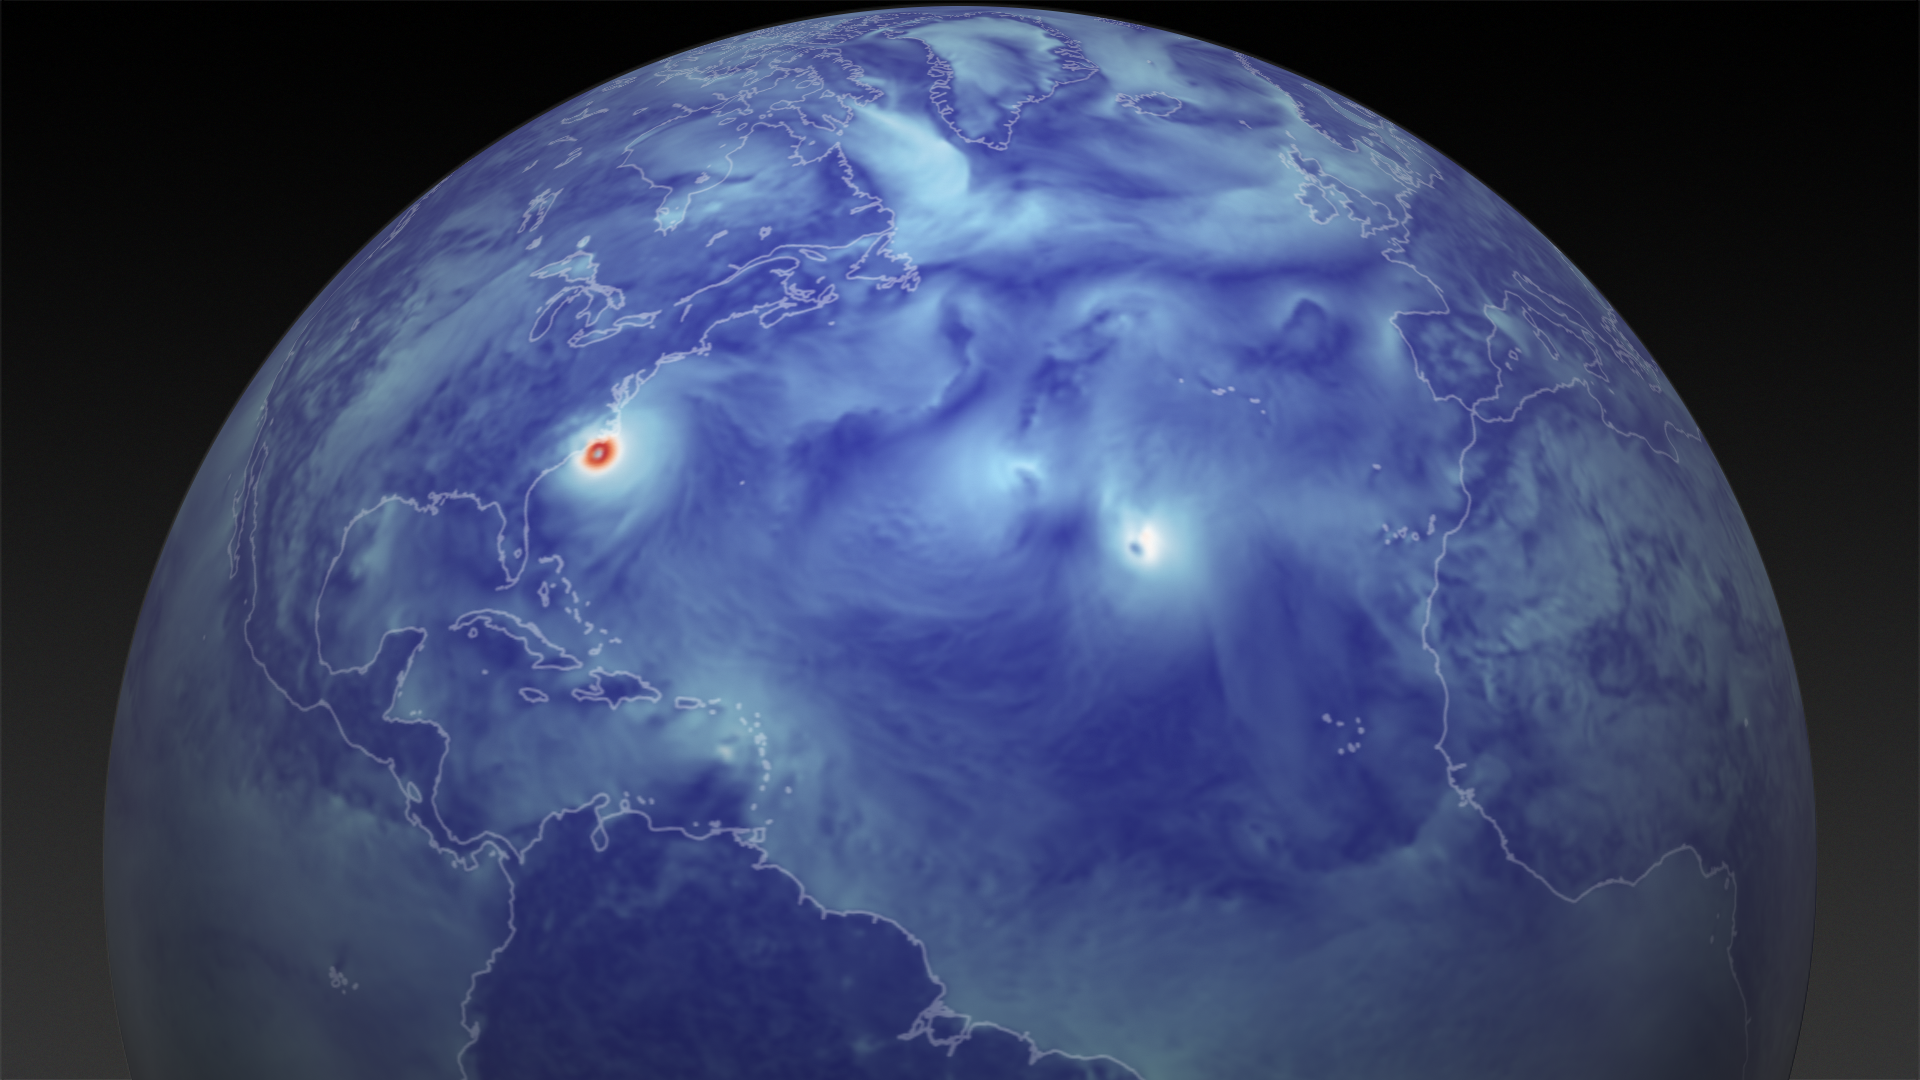
This animation highlights the storm’s wind field between September 1 and September 14, 2018. The strongest winds appear red; weaker winds are white. The wind data comes from the Goddard Earth Observing System Model (GEOS), an experimental weather model that scientists at NASA use to analyze global weather phenomena. The GEOS model ingests wind data from more than 30 sources, including ships, buoys, radiosondes, dropsondes, aircraft, and satellites.
Florence emerged off the west coast of Africa near Cape Verde on September 1. As the tropical storm drifted west, it slowly intensified until achieving hurricane status on September 4 with peak winds of 75 miles (120 kilometers) per hour. By tradition, meteorologists use the Saffir-Simpson scale to categorize hurricane intensity. Category 1 hurricanes have winds of between 74 and 95 miles (119 and 153 kilometerss) per hour; Category 5 storms, the highest on the scale, have winds that surpass 157 miles (252 kilometers) per hour.
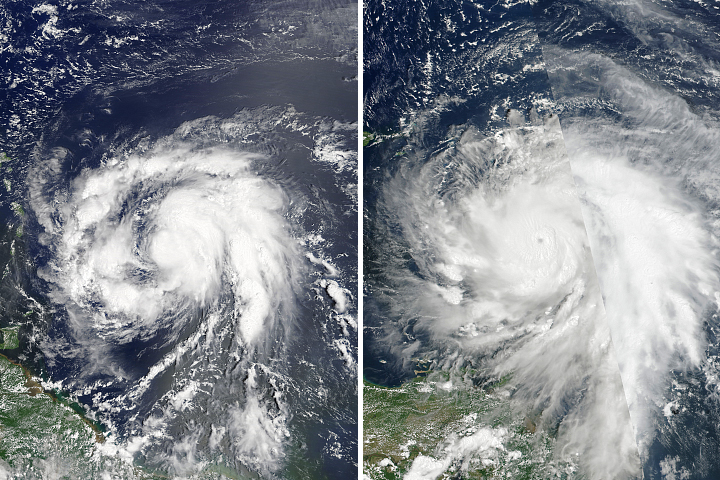
By September 5, Florence rapidly intensified, becoming a Category 4 storm with winds of 140 miles (225 kilometers) per hour. This was followed by a few days of increasing wind shear, which forced the storm into an asymmetrical shape and began to tear it apart. By September 7, Florence’s peak winds had dropped back down to 70 miles (100 kilometers) per hour, meaning it was no longer a hurricane. Then on September 9, Florence entered a zone of particularly low wind shear and high sea surface temperatures that led the storm to rapidly intensify. By September 10, the winds were back to Category 4 status.
As Florence continued to move west, it once again encountered areas of moderate wind shear that began to disrupt the circulation. As the storm neared land on September 13-14, “its outer bands began to interact with the Carolinas and friction began to play a part in slowing the winds,” explained Marangelly Fuentes, a NASA atmospheric scientist who has been tracking the storm for the Global Modeling Assimilation Office. By the time Florence made landfall at Wrightsville Beach, North Carolina, it was a Category 1 storm.
But as Fuentes and many other meteorologists have emphasized, wind speeds are only part of what can make a hurricane damaging. In Florence’s case, the storm grew larger and slowed down as it approached land. Though the winds weakened, they helped pile up the waves and storm surges that can make a storm even more dangerous.
“Peak winds and the Saffir-Simpson scale do not take into account the other dangers that come with a tropical cyclone—storm surge and rainfall,“ said Fuentes. “Storm surge and flooding almost always cause more deaths and damage in a hurricane than high winds.”
NASA Earth Observatory images by Joshua Stevens, using GEOS data from the Global Modeling and Assimilation Office at NASA GSFC. Story by Adam Voiland.