

Through several decades of observations, oceanographers have found that the tropical Pacific accounts for about 20 percent of all primary ocean productivity. They also have found that the physics of that ocean basin—the way temperatures, winds, and currents stir up the water—strongly influences the biology moreso than in other parts of the global ocean.
But does the biology of the tropical Pacific change over time and, if so, how does it change? Satellite-based studies of ocean color over the past two decades have revealed some regional, seasonal, and annual patterns. But the large-scale patterns across multiple years and decades are much harder to decipher because of the short record of observations.
New research led by Stephanie Schollaert Uz (NASA’s Goddard Space Flight Center) and colleagues could help ocean scientists better understand how patterns can change over time and how they might respond to a changing climate. The research team has built a statistical reconstruction of Pacific chlorophyll measurements dating back to 1958. It is the first basin-wide, monthly view of chlorophyll changes in the era of modern oceanographic measurements.
Chlorophyll has been measured consistently by satellites for the past 20 years. (There were some early, limited measurements in the late 1970s and 80s.) Chlorophyll is a proxy measurement for phytoplankton—floating, microscopic plant-like organisms that form the center of the marine food web; that is, they are the primary producers on which other organisms feed.
Like plants on land, phytoplankton use chlorophyll to harness sunlight for energy, so the abundance of chlorophyll tells us the abundance of phytoplankton. Furthermore, the location of phytoplankton usually tells us where we can find zooplankton, fish, and higher marine animals that consume them. This primary productivity also plays a key role in producing oxygen and absorbing carbon dioxide from the atmosphere.
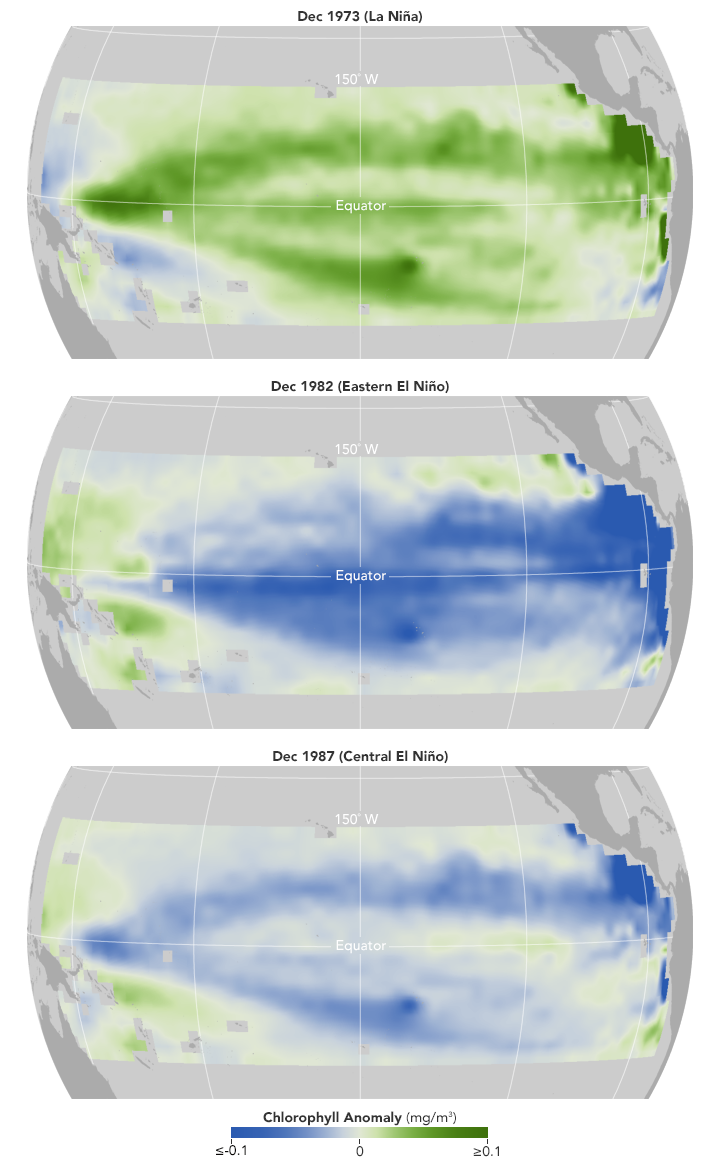
The maps above show chlorophyll anomalies in the equatorial Pacific Ocean; that is, how much the concentration of chlorophyll (and therefore phytoplankton) was above or below the long-term norm for the region. (Shades of blue represent less chlorophyll, while stronger greens show areas with more.) The maps are based on the reconstruction developed by Schollaert Uz and colleagues. They highlight a strong La Niña event in 1973, a very strong, basin-wide El Niño in 1982, and a strong Central Pacific El Niño in 1987.
In the tropical Pacific Ocean, sunlight is abundant year round, unlike other regions where changing seasons mean more or less light for phytoplankton. With consistent sunlight, the limiting variable for tropical phytoplankton is the amount of nutrients available near the surface—which is driven by how water is moved by currents and winds.
The “normal” state of the tropical Pacific Ocean has a warm, fresh pool of biologically unproductive water on the surface of the Western Pacific, while cooler, nutrient-rich water wells up in the Eastern Pacific. El Niño and La Niña events shift that balance. La Niña conditions spread the cooler, nutrient-rich waters farther westward across the Pacific, promoting phytoplankton growth across a wider area. El Niño brings much warmer water toward the Central and Eastern Pacific, shutting down the nutrient supply and much of the phytoplankton growth. Eastern Niños tend to suppress growth across the entire basin, while the effects of Central Niños are much more localized.
Schollaert Uz and colleagues constructed their statistical model by taking more than 11 years of real-world measurements from the SeaWiFS instrument and correlating them to other data and models of ocean conditions. They then compiled known measurements of sea surface temperatures and heights in the tropical Pacific dating back to 1958 and reconstructed what chlorophyll concentrations should have looked like every month for fifty years.
“Direct observations are best, but basin-wide observations of sea-surface chlorophyll do not exist before consistent ocean color measurements began in 1997,” said Schollaert Uz. “We took advantage of the fact that Earth is a coupled system, in which tropical Pacific Ocean biology is largely controlled by physics, and used the longer physical records to reconstruct a large-scale view of chlorophyll.”
The reconstruction will allow researchers to examine and extrapolate conditions during El Niño and La Niña events that were not captured by satellite. Several studies have shown, for instance, that winds and ocean upwelling might have been more or less intense in the 1950s through the 1970s, but there is no corresponding ocean color data to demonstrate how that affected biology. The new statistical model offers a look into the recent past that could ultimately help us better see the future.
NASA Earth Observatory images by Jesse Allen, using data provided by Stephanie Uz (NASA/GSFC). Story by Mike Carlowicz.