

The same slow-moving storm front that buried parts of Colorado under several feet of snow in April 2016 later pushed into the Great Plains states and Texas. Moisture from the Gulf of Mexico was drawn into the already potent system, drenching eastern and southern Texas with unusually intense rainfall.
When a stationary complex of thunderstorms sprang up over Houston on April 17 and April 18, torrential rain fell on the low-lying city. In some areas, rain rates soared to 4 inches (100 millimeters) per hour. According to the National Weather Service, 9.92 inches fell on George Bush Intercontinental Airport on April 18—making it the second wettest day on record for the city. The surge of rain triggered flash floods affecting several thousand homes; hundreds of people had to be rescued and seven people drowned. Officials estimate that the floods caused more than $5 billion dollars of damage to the city.
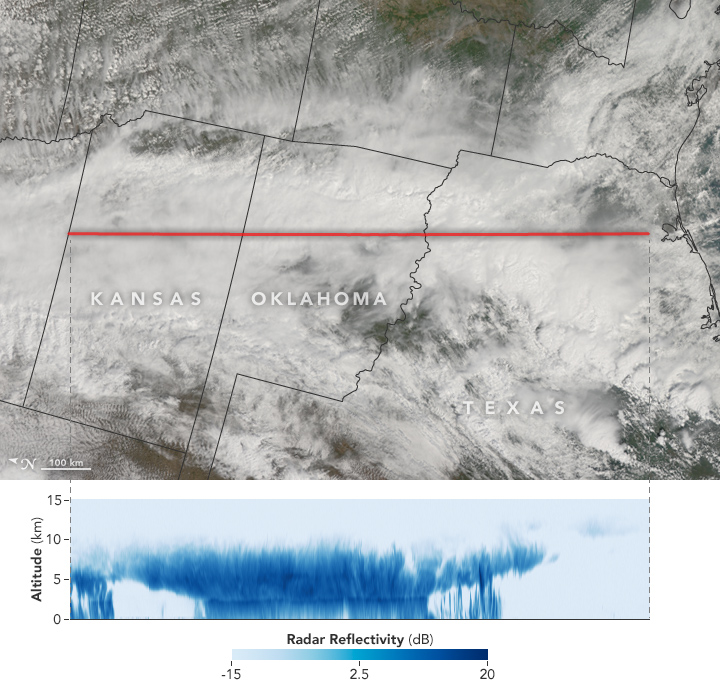
NASA satellites captured complementary data and imagery of the storm as it approached Houston. The blue image above, made from data collected by a cloud-penetrating radar on CloudSat, shows a cross section of the storm—what it would look like if it had been sliced near the middle and viewed from the side. The top image was acquired the same day by the Moderate Resolution Imaging Spectroradiometer (MODIS) on the Aqua satellite. The red line is the north-to-south track that CloudSat flew over the storm. Note that the MODIS image has been rotated so that north is to the left.
In the CloudSat data, the darkest blues represent areas where clouds and raindrops reflected the strongest signal back to the satellite radar. These areas had the heaviest precipitation and the largest water droplets. The blue horizontal line is the freezing line; ice particles formed above it, raindrops below it. The thickness of the clouds offers a clue about the intensity of the precipitation. Thicker clouds generally produce more intense rain. In this case, cloud tops reached up to 13 kilometers (8 miles).
The CloudSat data also highlights some differences across the region. In the northern part of the transect, there is a continuous sheet of rainfall. In the southern part, the front consists of individual cells of activity with more scattered rainfall and higher clouds—a sign of the increased levels of convection.
Editor’s Note: Ten years ago, CloudSat was lofted into space by a Delta rocket launched from Vandenberg Air Force Base. Click here to see a gallery of some of the greatest hits from CloudSat.
NASA Earth Observatory image by Jesse Allen, using CloudSat FirstLook data provided courtesy of the CloudSat team at Colorado State University. Caption by Adam Voiland