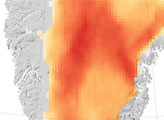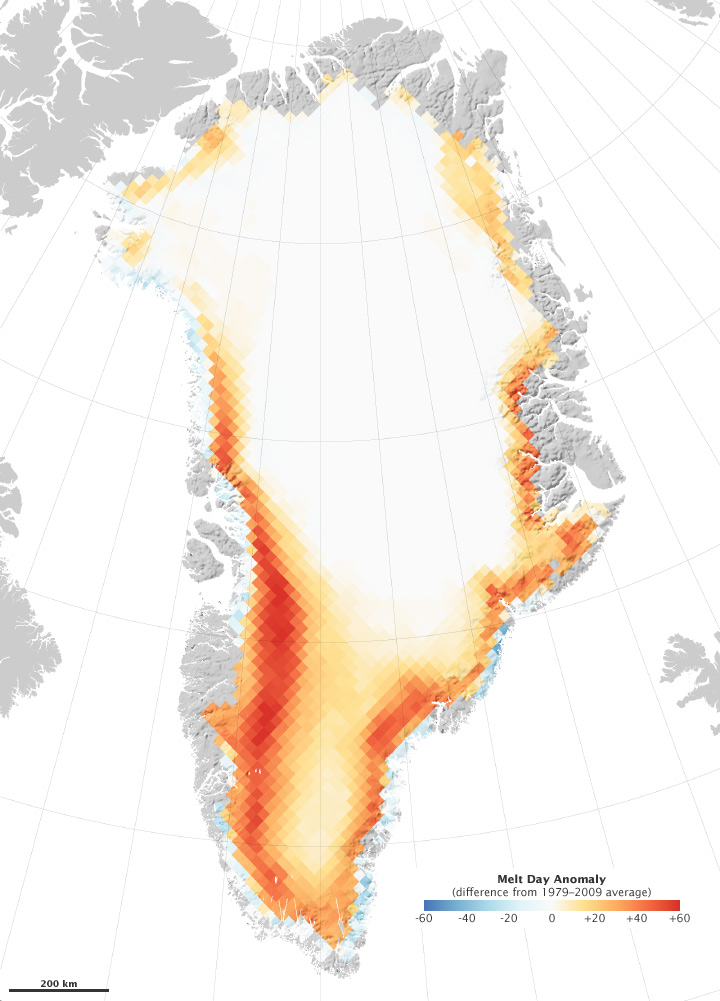
2010 was an exceptional year for Greenland’s ice cap. Melting started early and stretched later in the year than usual. Little snow fell to replenish the losses. By the end of the season, much of southern Greenland had set a new record, with melting that lasted 50 days longer than average.
This image was assembled from microwave data from the Special Sensor Microwave/Imager (SSM/I) of the Defense Meteorological Satellites Program. Snow and ice emit microwaves, but the signal is different for wet, melting snow than for dry. Marco Tedesco, a professor at the City College of New York, uses this difference to chart the number of days that snow is melting every year. This image above shows 2010 compared to the average number of melt days per year between 1979 and 2009.
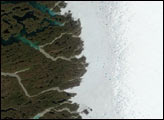
The long melt season primarily affected southern and western Greenland, where communities experienced their warmest year on record. After a warm, dry winter, temperatures were particularly high in the spring, getting the melt season off to a strong start. The early melting set the tone for the rest of the season, leading to more melting all the way into mid-September.
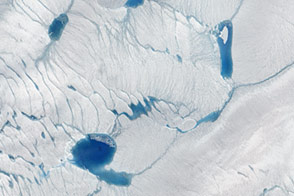
When snow melts, the fine, bright powder turns to larger-grained, gravely snow. These large grains reflect less light, which means that they can absorb more energy and melt even faster. When the annual snow is melted away, parts of the ice cap are exposed. The surface of the ice is also darker than snow. Since dark ice was exposed earlier and longer in 2010, it absorbed more energy, leading to a longer melt season. A fresh coat of summer snow would have protected the ice sheet, but little snow fell.
Melting ice in Greenland freshens the seas near the Arctic and contributes to rising sea levels around the world. It is unclear just how much melting ice from Greenland will push sea levels up, largely because the melting is occurring much more quickly than scientists predicted. Current estimates call for an increase of up to 0.6 meters by 2100.
To see how this melting looked on the surface of the ice sheet, see Tedesco’s photos and video on the City College of New York web site.
NASA Earth Observatory image by Robert Simmon, based on data from Marco Tedesco, City College of New York. Caption by Holli Riebeek.