Every spring or early summer, the surface of the Greenland Ice Sheet transforms from a vast white landscape of snow and ice to one bejeweled with blue meltwater streams, rivers, and lakes. In 2016, the transition started early and fast.
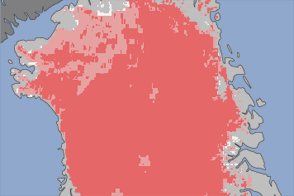
“This year we had some really early season melt events that kick-started things,” said Allen Pope, a scientist at the National Snow & Ice Data Center (NSIDC). According to an NSIDC blog post, the ice sheet saw three extreme spikes in melt by June 19. As a result, the pace of melting so far is ahead of the past three seasons, but behind the record melt year of 2012.
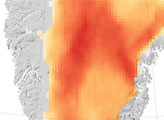
Coastal areas have been generally warmer than average, and sometimes extreme. For instance, temperatures in Nuuk soared to 24 degrees Celsius (75 degrees Fahrenheit) on June 9, 2016—the highest June temperature ever recorded there. Interior areas were slightly cooler than usual.
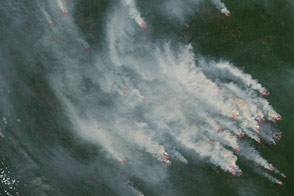
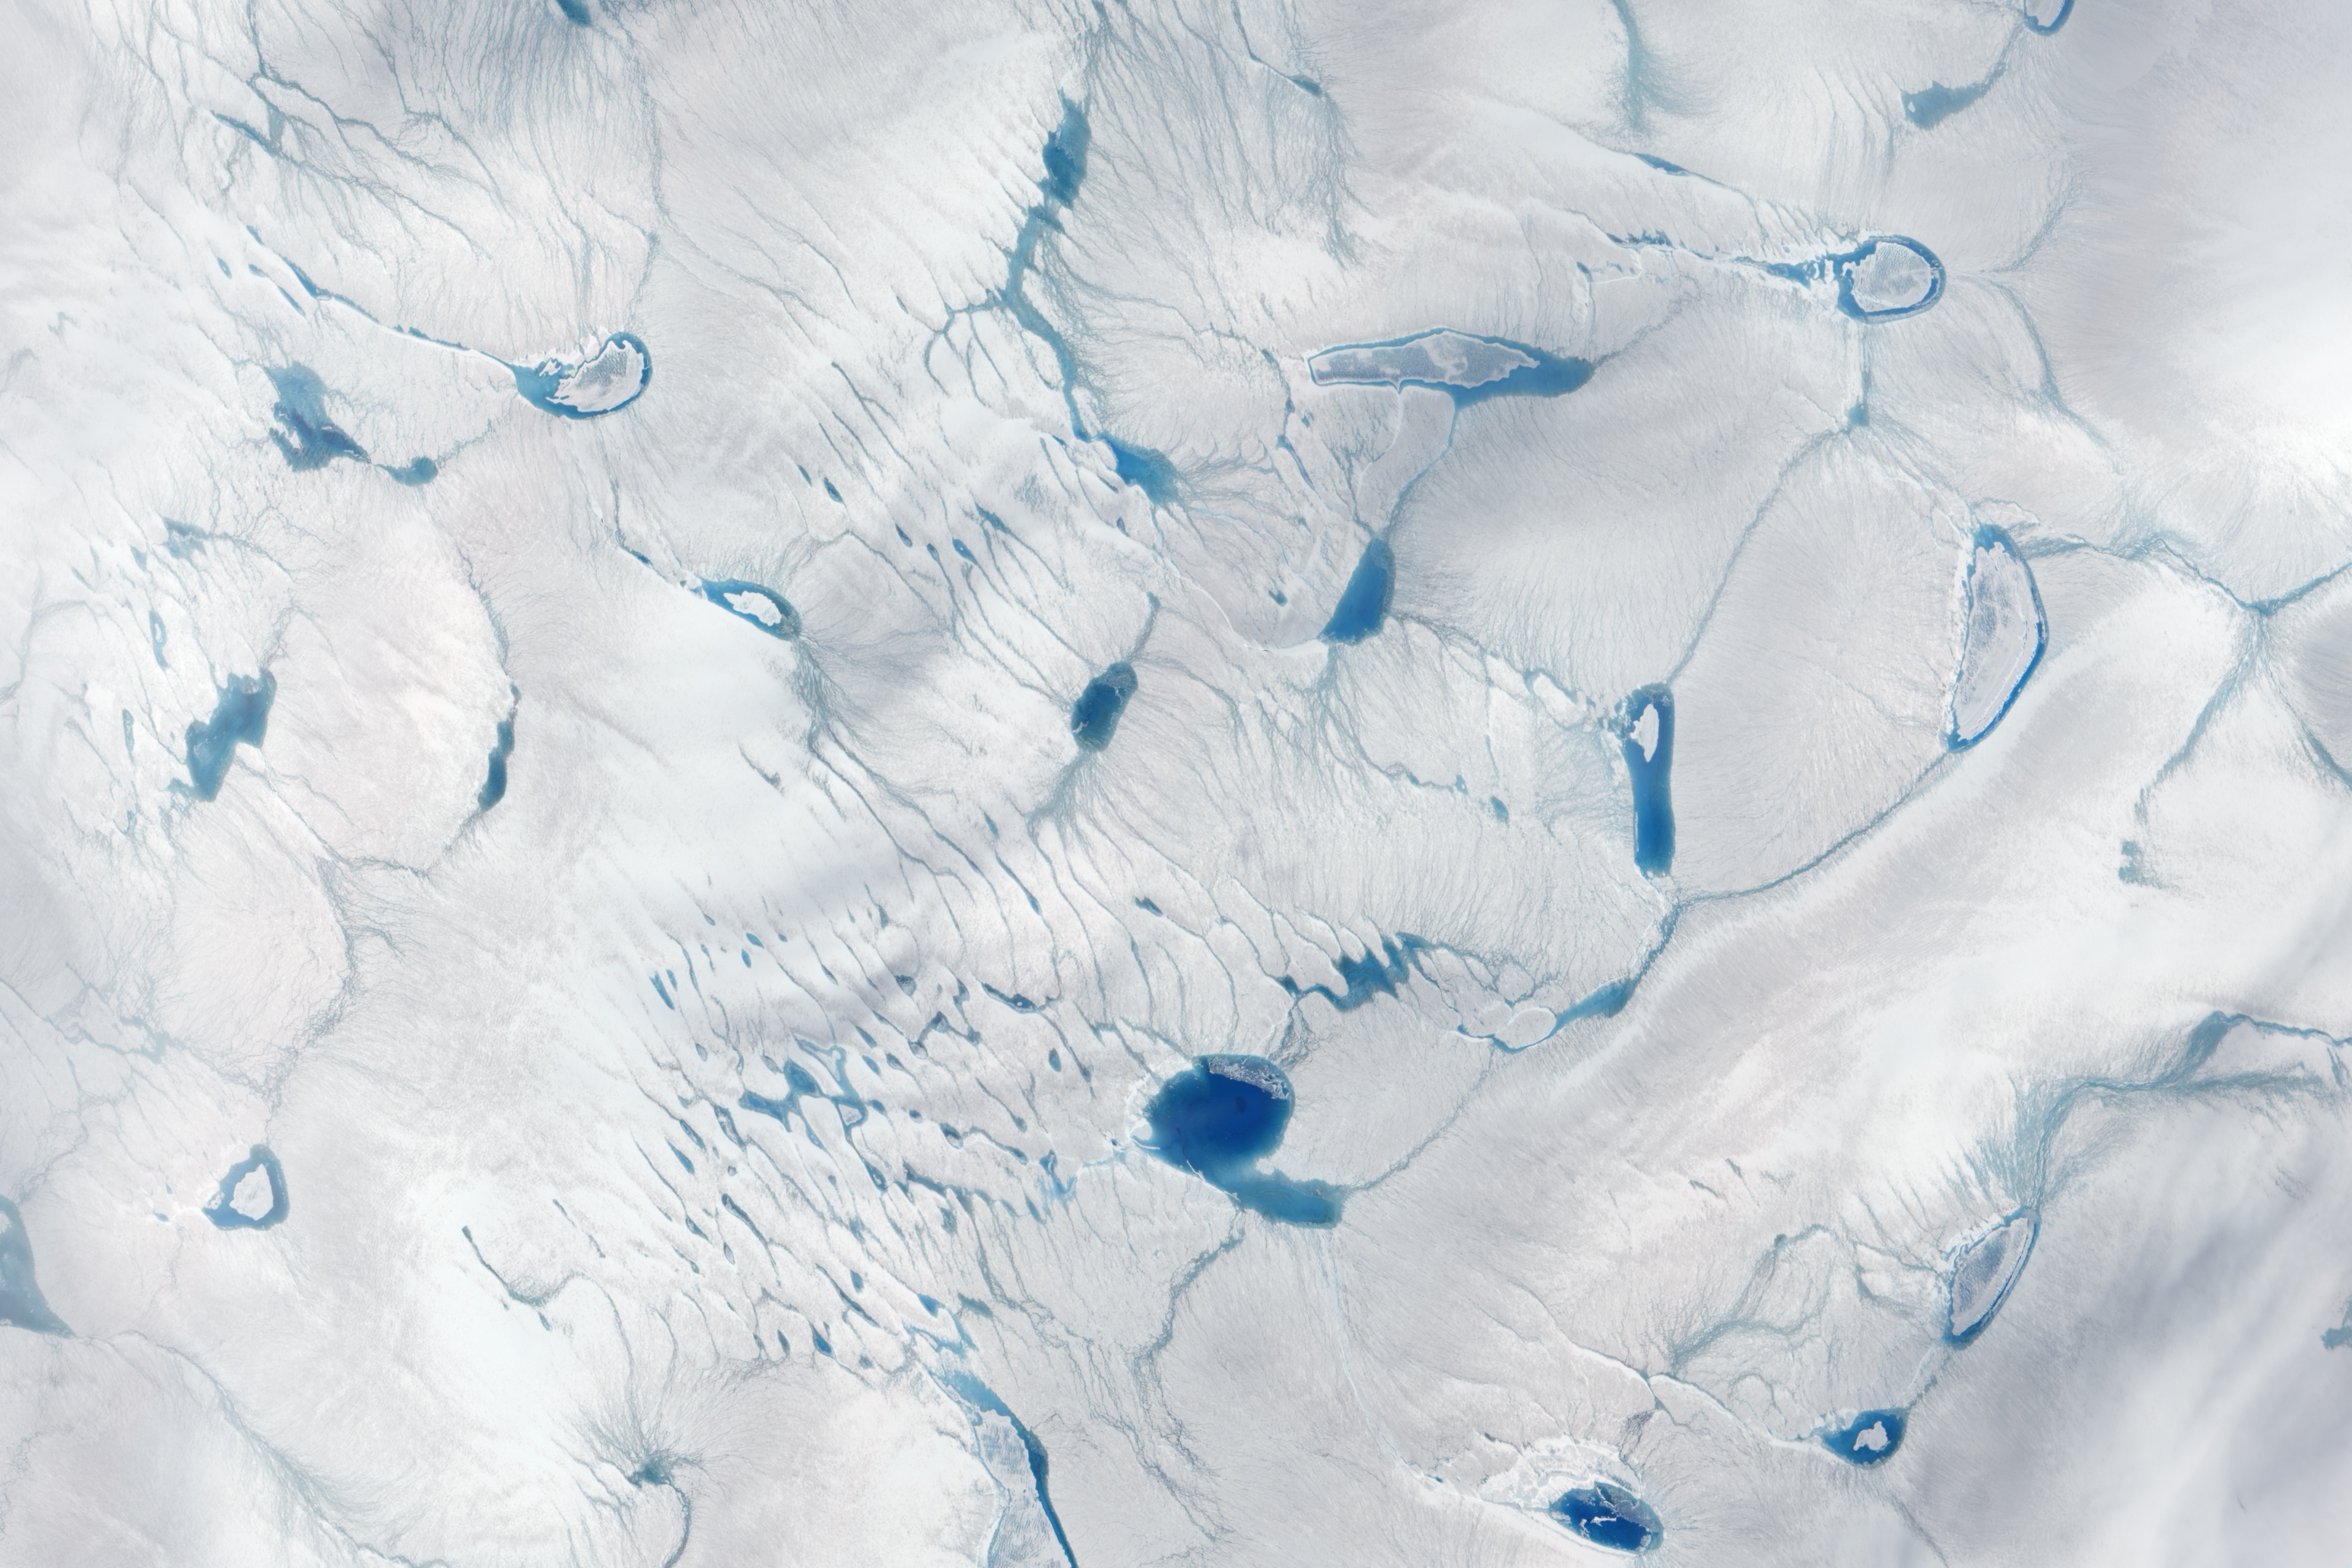
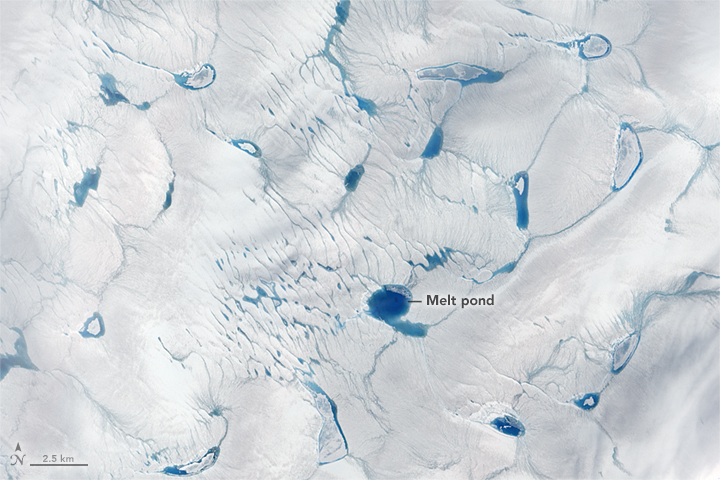
On June 15, 2016, the Advanced Land Imager (ALI) on NASA’s Earth Observing-1 satellite acquired a natural-color image of an area just inland from the coast of southwestern Greenland (120 kilometers southeast of Ilulisat and 500 kilometers north-northeast of Nuuk). According to Marco Tedesco, a professor at Columbia University’s Lamont Doherty Earth Observatory, melting in this area began relatively early in April but was not sustained. It started up again in May and grew into the watery June scene pictured above.
Surface melt can directly contribute to sea level rise via runoff. It can also force its way through crevasses to the base of a glacier, temporarily speeding up ice flow and indirectly contributing to sea level rise. Also, ponding of meltwater can “darken” the ice sheet’s surface and lead to further melting.
“All these processes tend to accelerate further melting through so-called positive feedback mechanisms,” Tedesco said. “The more melting you have, the more melting will increase in a way that melting feeds on itself. I call this melting cannibalism.”
Not every melt season follows the same progression. Pope notes that almost no lake water was present in mid-June in 2014 and 2015, then volumes of meltwater peaked each year by mid-July.
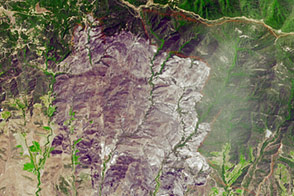
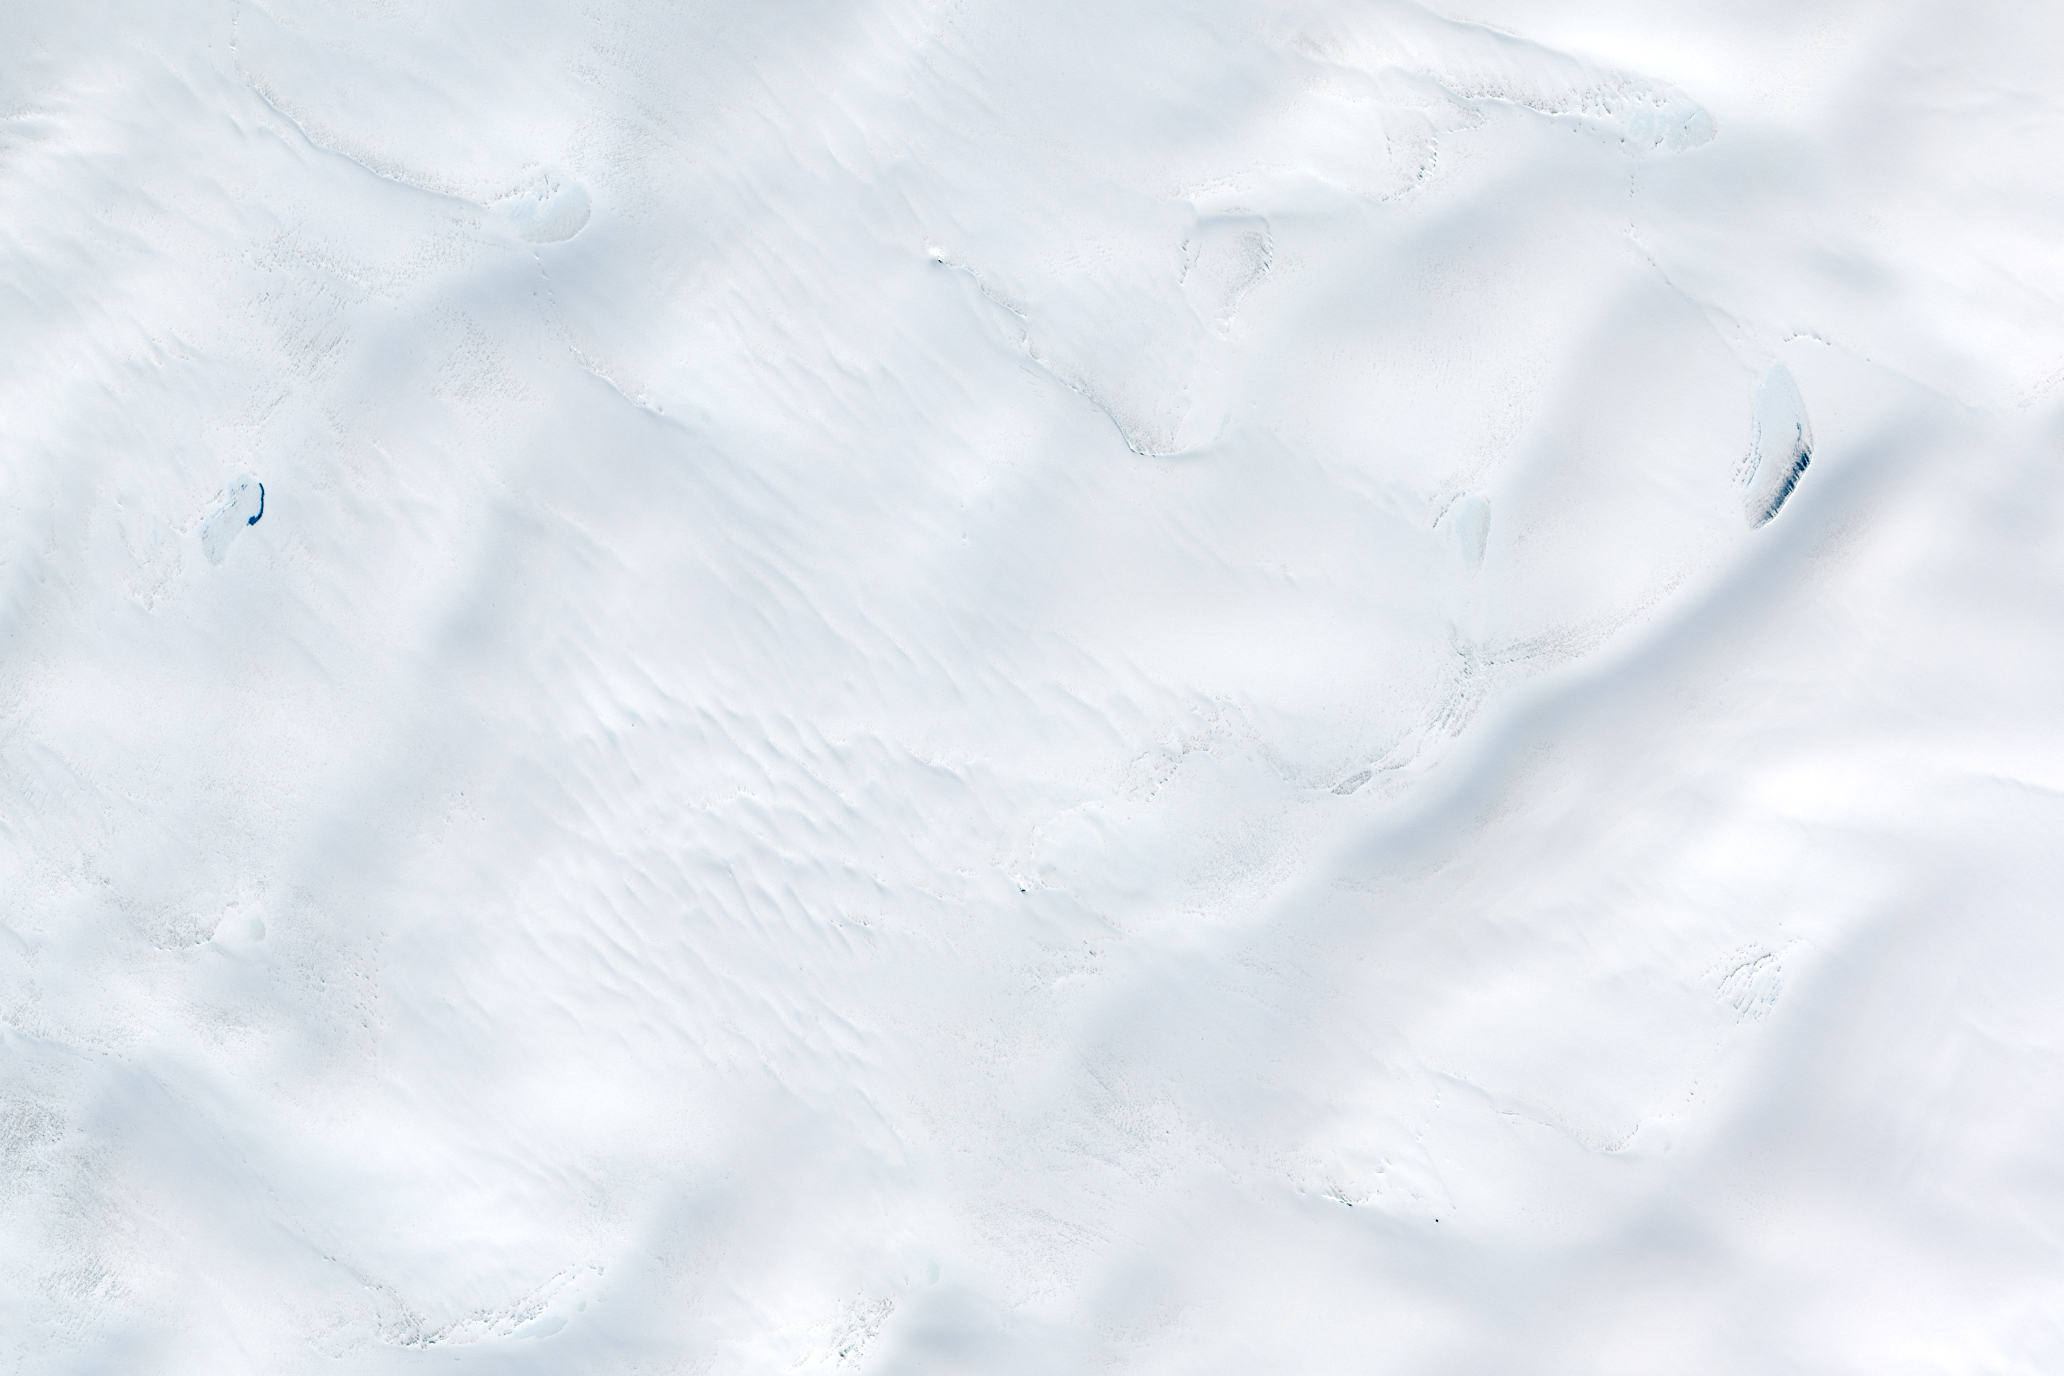
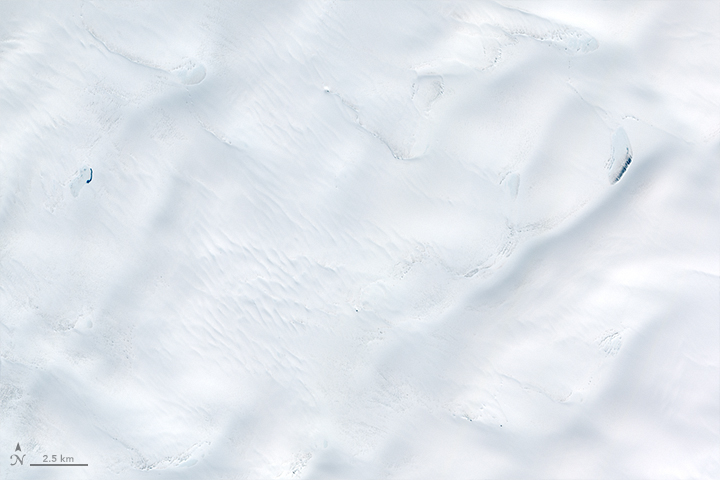
The second image shows the same area on June 10, 2014, as observed by the Operational Land Imager (OLI) on the Landsat 8 satellite. (Clouds obscured the view from space in June 2015.) Melt ponds on this day were not nearly as developed as they were in 2016. Turn on the image comparison tool to see the difference.
According to Tedesco, 2014 was not an exceptional melting year. The season was generally colder and wetter, and it’s possible that there’s even some recent snowfall visible in the image.
It remains to be seen how surface melt in 2016 will progress. Melting could continue in July or level off. “So far, melting has been above average,” Tedesco said. “But we still need to see what will happen over the next few weeks, which are crucial as it is when the sun is strongest and the peak of melting usually occurs.”
NASA Earth Observatory image by Jesse Allen, using EO-1 ALI data provided courtesy of the NASA EO-1 team and Landsat data from the U.S. Geological Survey. Caption by Kathryn Hansen.
alert message