


NASA flies three large, multi-sensor satellites that monitor Earth’s land, atmosphere, oceans, and energy balance. Because the instruments on each satellite are taking measurements at the same time from the same vantage point, scientists are able to compare observations and tease out connections between different parts of the Earth system. The first of the three satellites, Terra, launched ten years ago on December 18, 1999. In the decade since Terra launched, scientists have gained insight into the intricate connections that shape our planet’s climate. The relationship between snow, clouds, and sunlight is a good example.
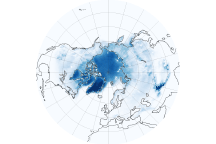
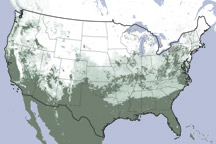
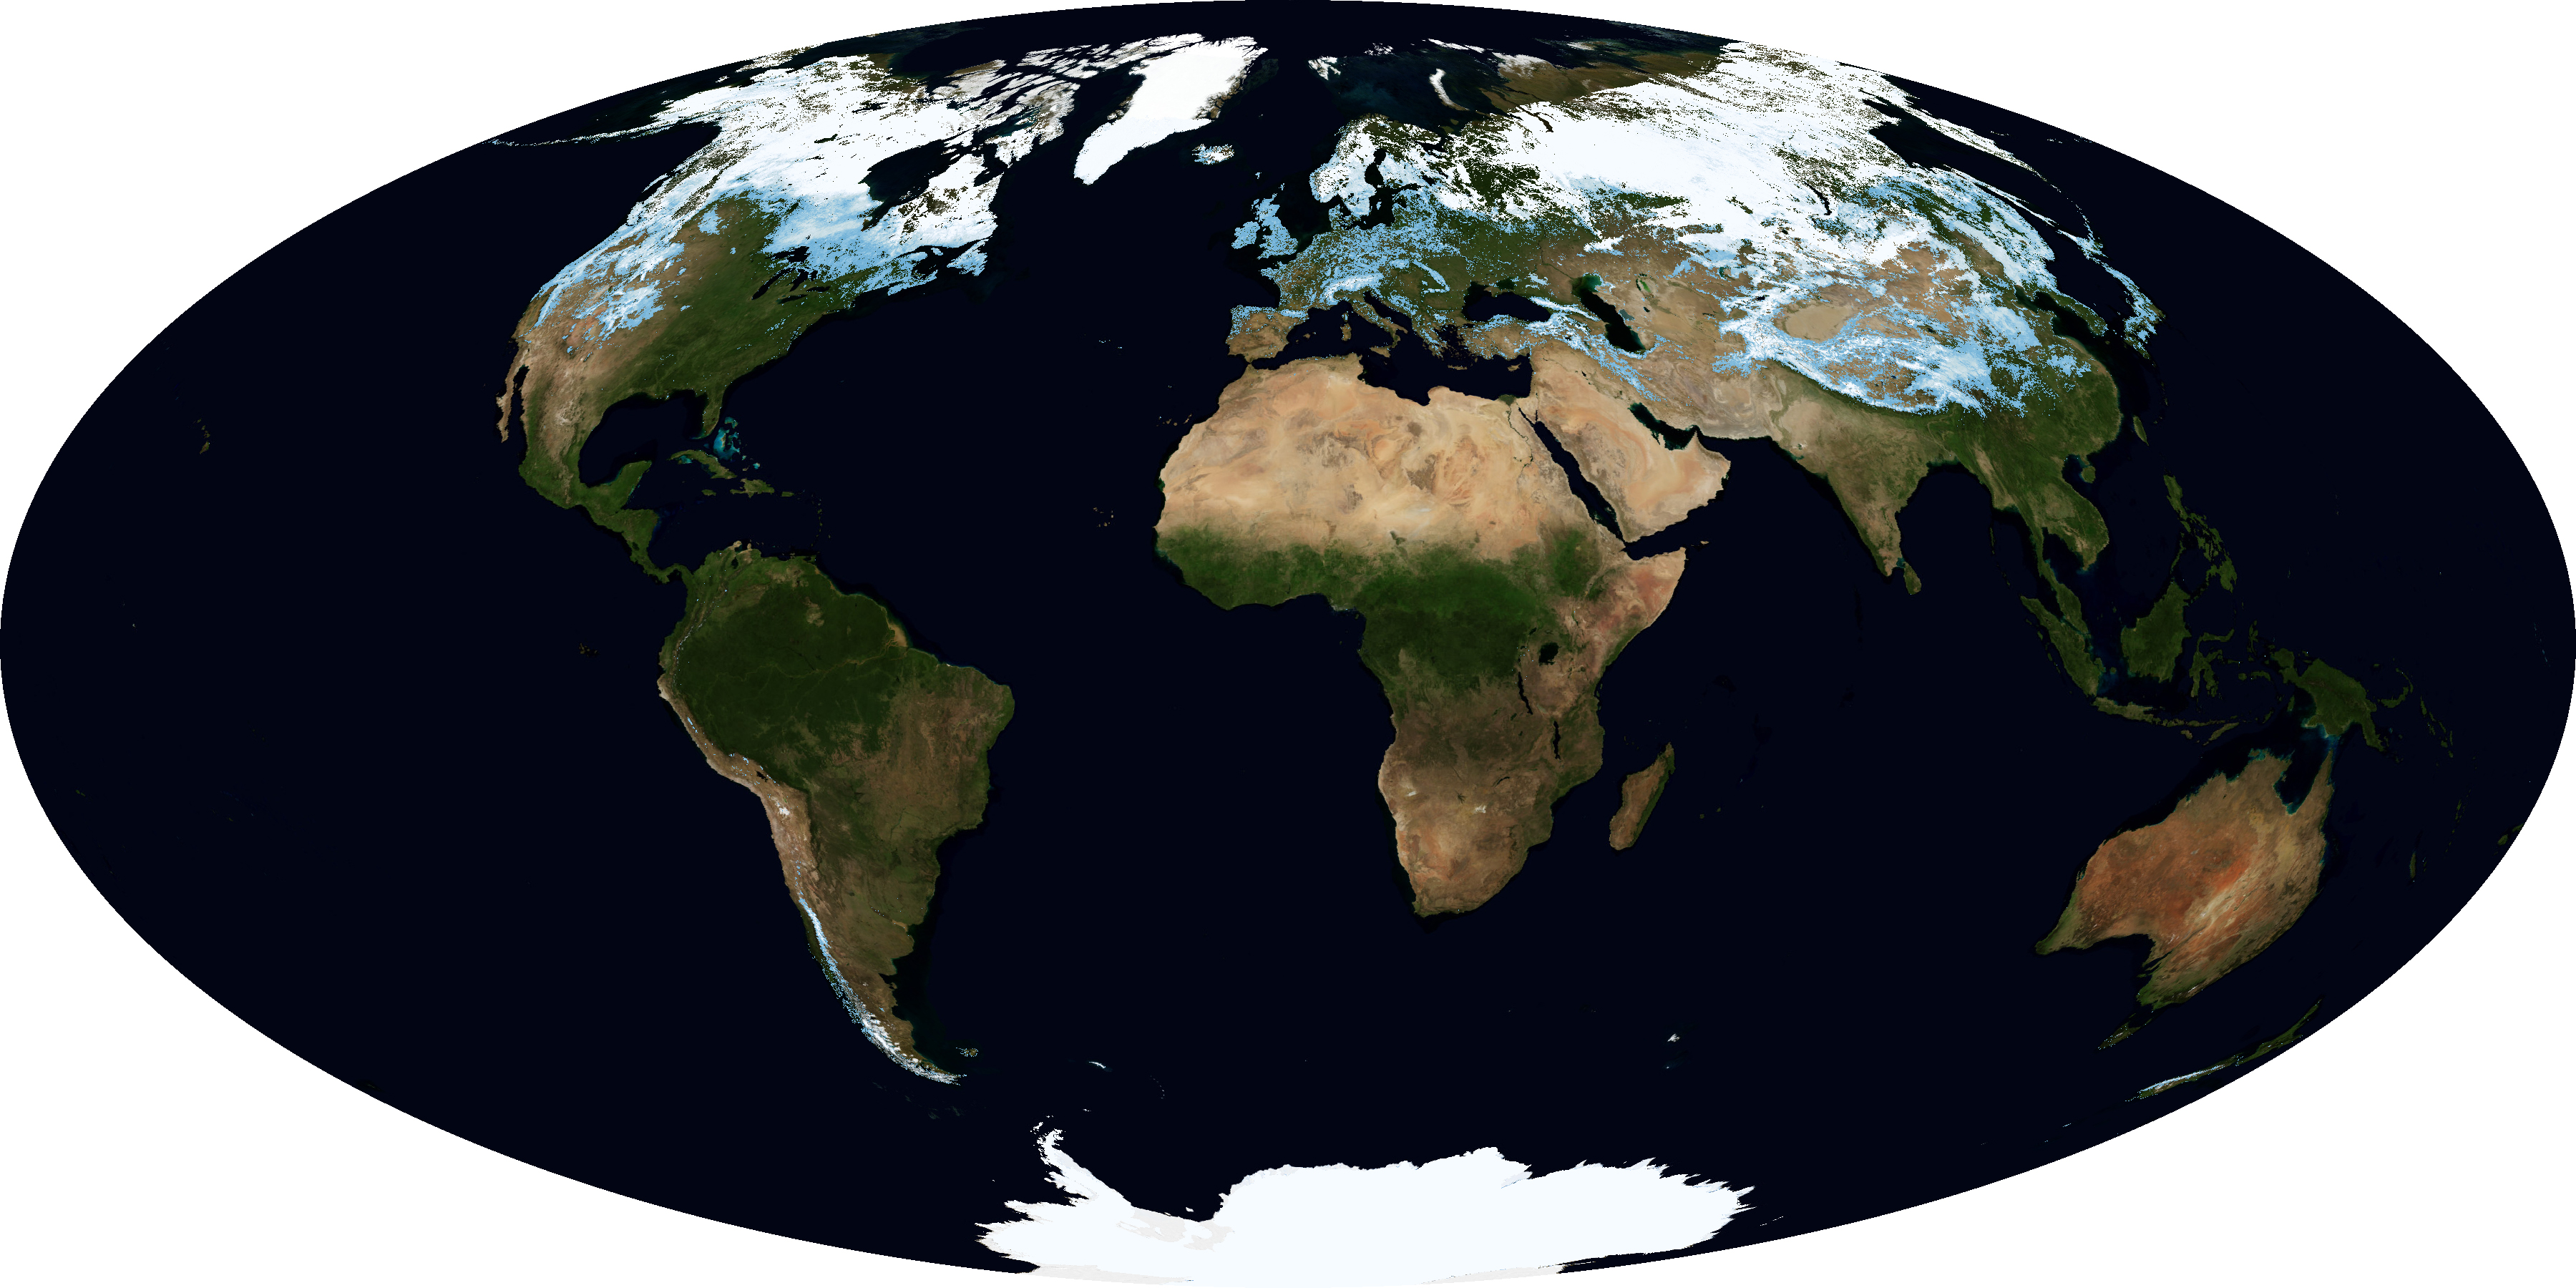
In November, the chill and snow of a Northern Hemisphere winter is on the horizon. Snow covers the far north and high elevations, as shown in the map of percent snow cover in November 2009. White areas show where snow covers the ground completely, while blue points to areas with partial snow cover. At the peak of the northern winter, more than 40 percent of the Earth’s land will be covered in snow.
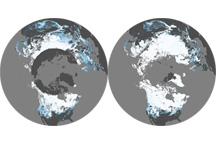
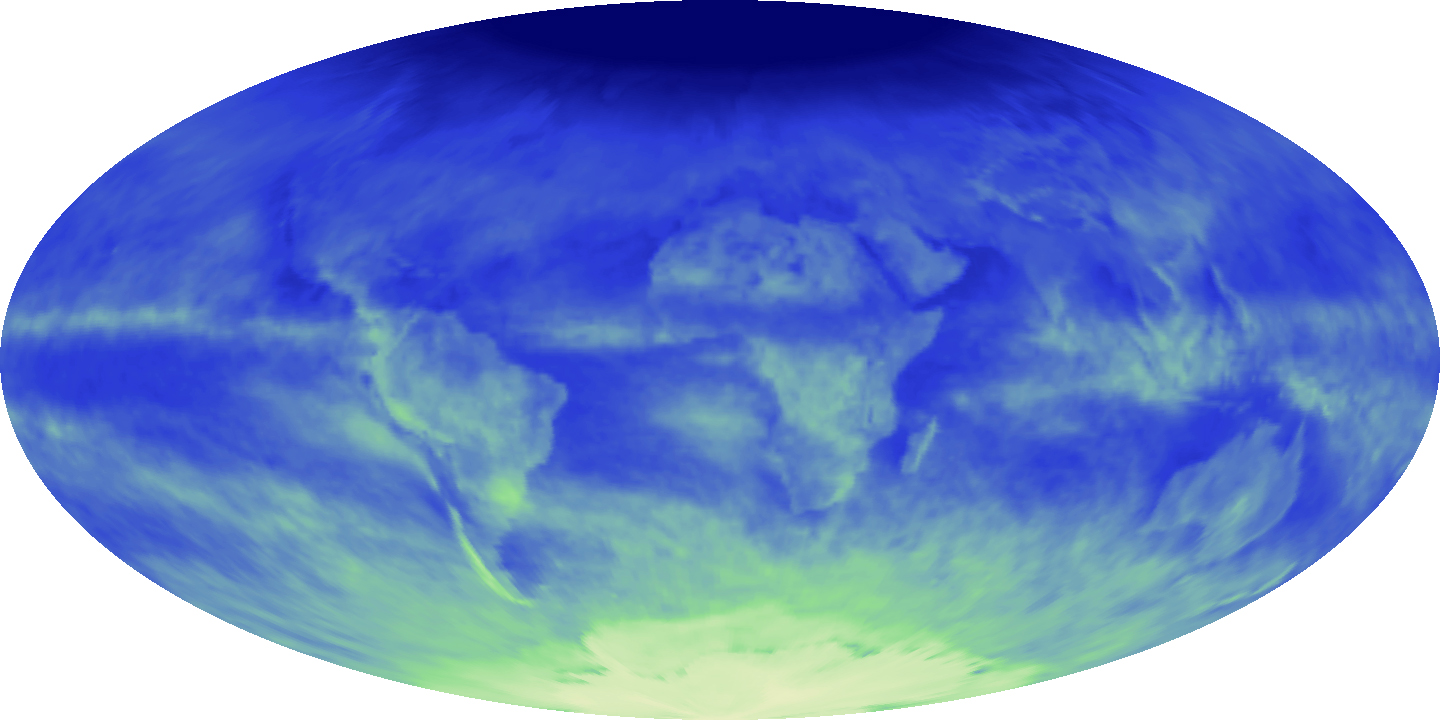
In addition to being an important, life-sustaining source of water, the snow also reflects sunlight, limiting the amount of heat the Earth absorbs from the Sun. Bright white snow is one of the most reflective surfaces on Earth, as shown in the map of reflected sunlight in November 2009 (bottom). Perpetually covered in snow and bathed in long hours of sunlight in November, Antarctica is bright yellow, an indication that most of the light coming from the Sun is being reflected back into space. The Northern Hemisphere is dark blue because little light reaches the north during the winter, so little is being reflected back into space.
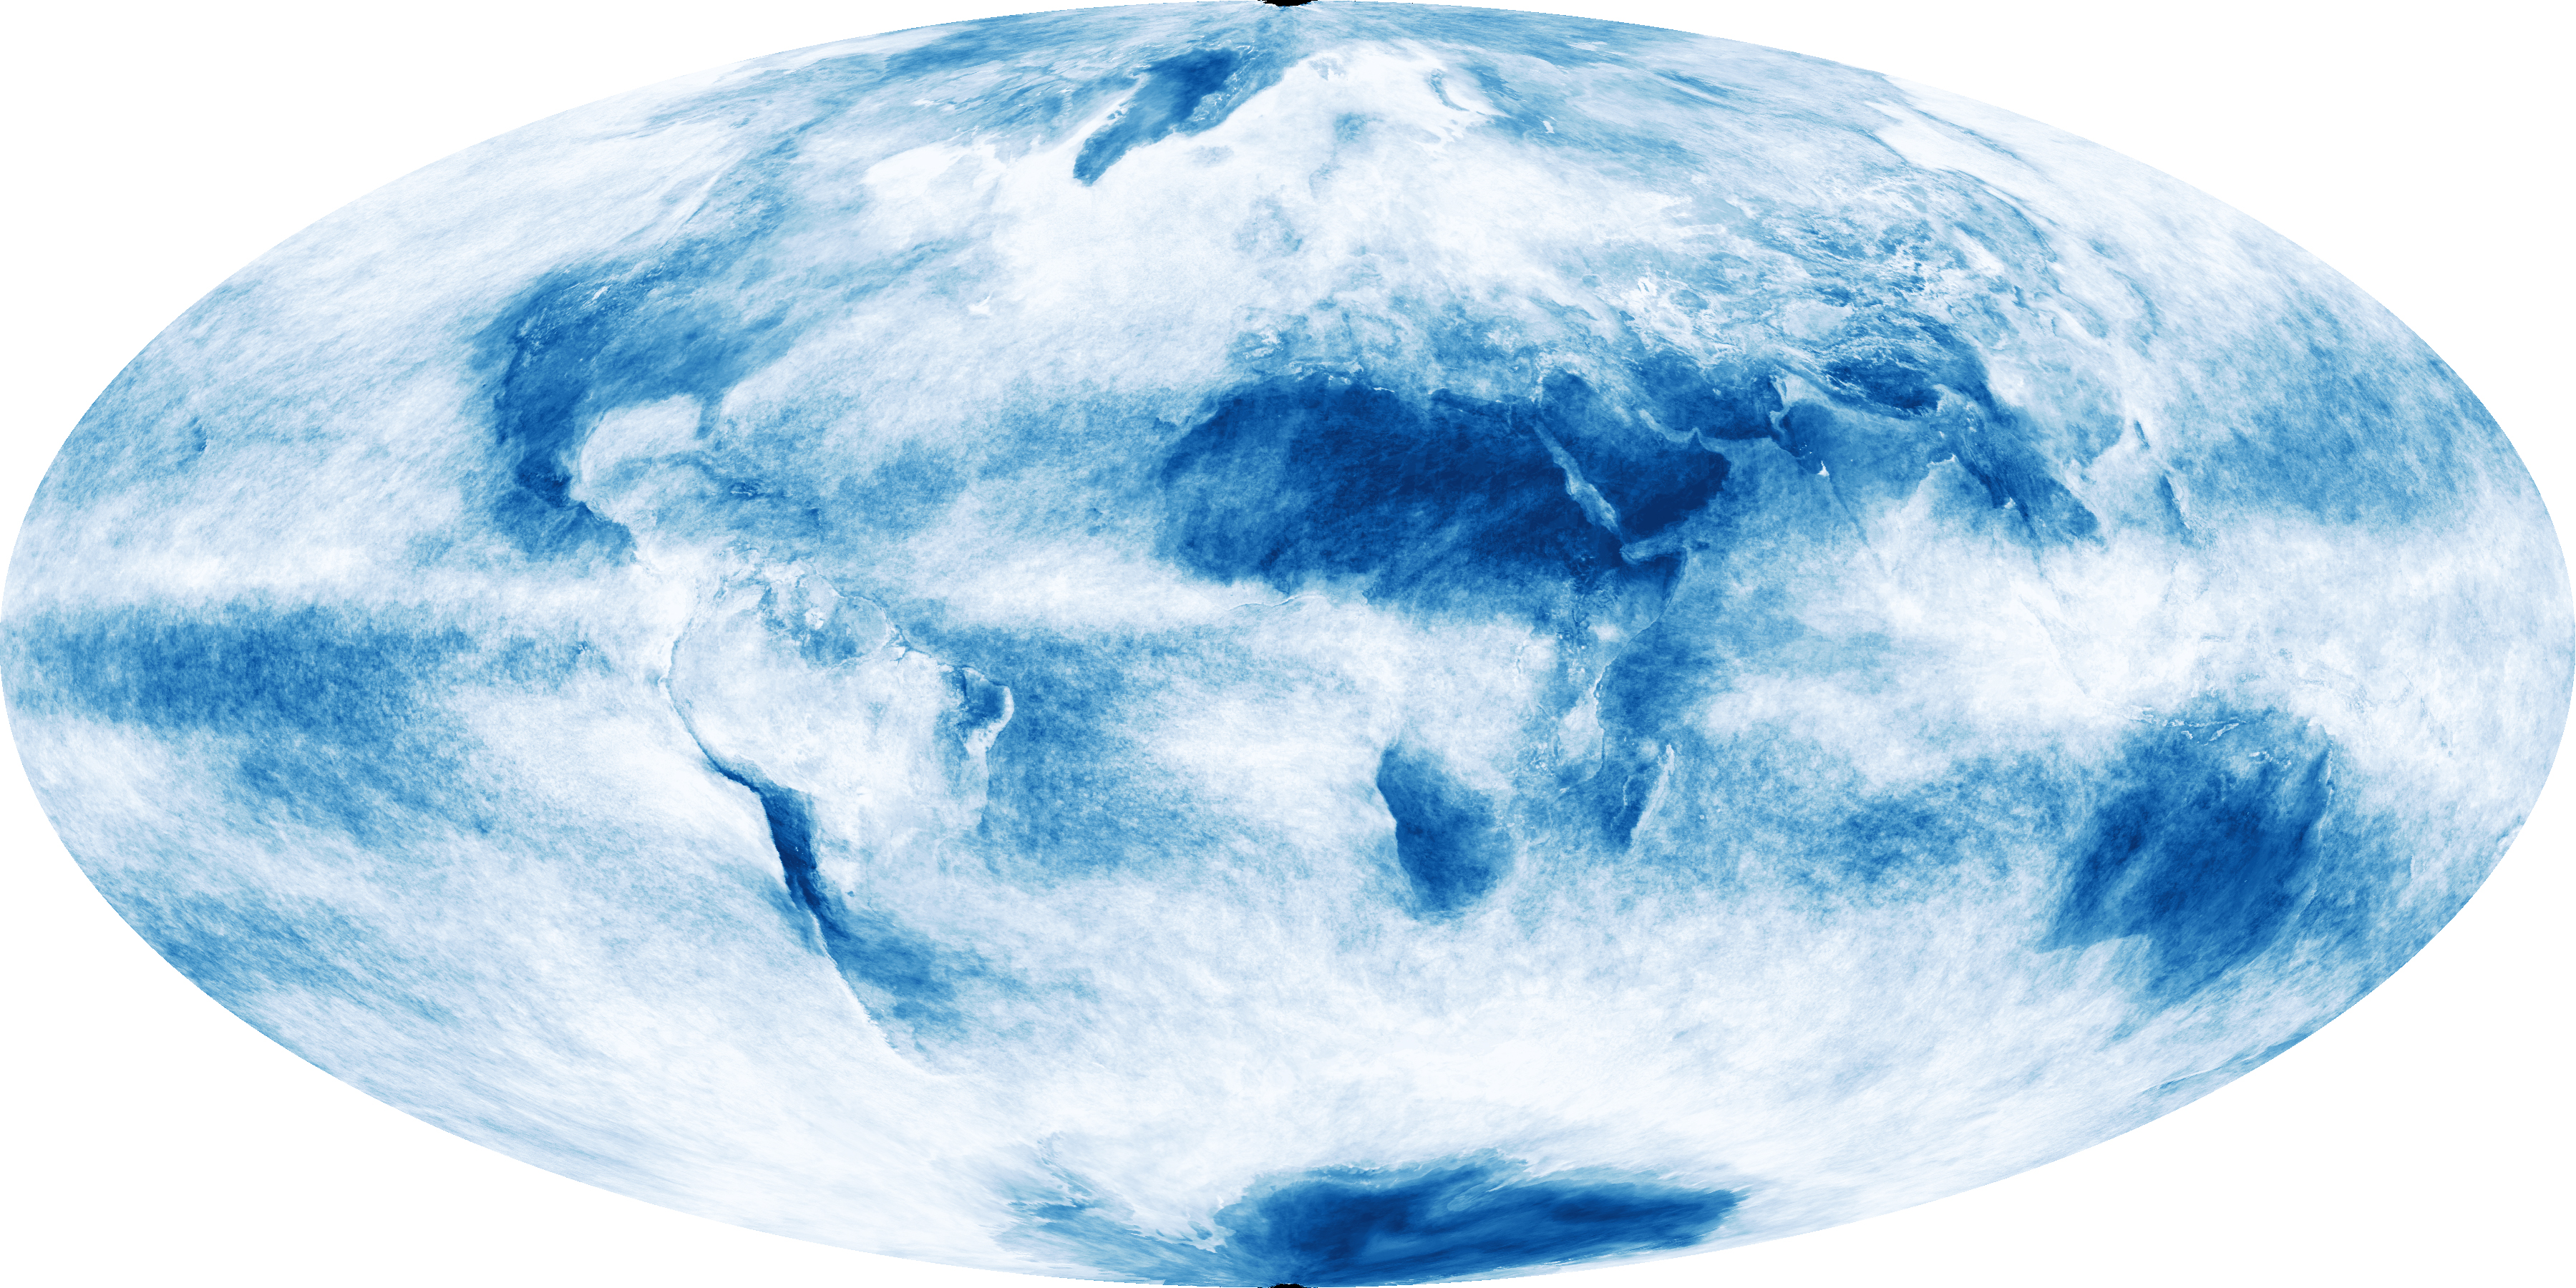
A band of yellow circles the equator in the energy map. This and other bright spots apart from Antarctica are clouds. Like snow, clouds are very reflective. The center image is a map of cloud cover in November 2009. The cloudiest areas, shown in white, correspond well with the areas where the most light was reflected.
As these images illustrate, a change in the extent of snow or cloud cover will also change Earth’s energy budget, the balance between energy from the Sun and energy reflected, absorbed, and emitted as heat from the Earth. The energy balance drives our climate, so changes in the energy balance will result in changes in our climate. Scientists use satellite measurements of cloud cover, snow fall, and energy to track Earth’s energy balance and monitor our changing climate.
Both the cloud and the snow cover maps were made from data collected by the Moderate Resolution Imaging Spectroradiometer (MODIS) on NASA’s Terra satellite. The map of reflected energy is from the Clouds and the Earth Radiant Energy System (CERES) sensor, also on the Terra satellite. Because all three measurements were taken at the same time and from the same perspective just over 700 kilometers from Earth’s surface, scientists can compare them to see the relationship between snow, clouds, and energy. The single platform also allows scientists to merge measurements. By combining MODIS’ detailed daily measurements of clouds with daily measurements of energy from CERES, for example, scientists have been able to track Earth’s energy balance more accurately.
NASA Earth Observatory images by Kevin Ward. Caption by Holli Riebeek.
Image of the Day Atmosphere Heat Land Snow and Ice
This trio of global maps illustrates how snow and clouds make Earth more reflective.
Image of the Day for December 18, 2009
View more Images of the Day:


alert message