

How could melting ice thousands of miles away possibly affect you? A recent study published in Nature Geoscience provides one answer to that question. Mark Flanner at the University of Michigan and his collaborators used satellite data to measure how much changes in snow and ice in the Northern Hemisphere have contributed to rising temperatures in the last 30 years. The loss of snow and ice warmed the planet more than models predicted it would.
Snow and ice help control how much of the Sun’s energy Earth soaks up. Bright white snow and ice reflect energy back to space. Because that energy does not get absorbed, it does not go into Earth’s climate. As a result, snow and ice cool the planet. This effect is called a climate forcing because snow and ice directly influence the climate.
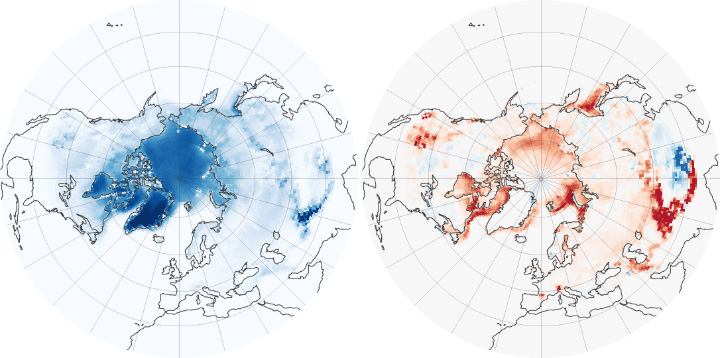
The left image shows how much energy the Northern Hemisphere’s snow and ice—called the cryosphere—reflected on average between 1979 and 2008. Dark blue indicates more reflected energy, in Watts per square meter, and thus more cooling. The Greenland ice sheet reflects more energy than any other single location in the Northern Hemisphere. The second-largest contributor to cooling is the cap of sea ice over the Arctic Ocean.
The right image shows how the energy being reflected from the cryosphere has changed between 1979 and 2008. When snow and ice disappear, they are replaced by dark land or ocean, both of which absorb energy. The image shows that the Northern Hemisphere is absorbing more energy, particularly along the outer edges of the Arctic Ocean, where sea ice has disappeared, and in the mountains of Central Asia.
“On average, the Northern Hemisphere now absorbs about 100 PetaWatts more solar energy because of changes in snow and ice cover,” says Flanner. “To put it in perspective, 100 PetaWatts is seven-fold greater than all the energy humans use in a year.” Changes in the extent and timing of snow cover account for about half of the change, while melting sea ice accounts for the other half.
Flanner and his colleagues made both calculations by compiling field measurements and satellite observations from the Moderate Resolution Imaging Spectroradiometer (MODIS), Advanced Very High Resolution Radiometer, and Nimbus-7 and DMSP SSM/I passive microwave data. The analysis is the first calculation of how much energy the entire cryosphere reflects. It is also the first observation of changes in that reflected energy across the entire cryosphere.
Image by Rob Simmon, made with data provided by Mark Flanner, University of Michigan. Caption by Holli Riebeek.