The Earth Observatory has published its last Image of the Day on this website. Please join us on our new home at science.nasa.gov/earth/earth-observatory.
On June 29, 2009, NASA and Japan’s Ministry of Economy, Trade, and Industry (METI) released the most extensive satellite-based topographic model of Earth to date. Created using data from the Advanced Spaceborne Thermal Emission and Reflection Radiometer ASTER, which flies on NASA’s Terra satellite, the data compliments previous digital elevation information available from the Shuttle Radar Topography Mission (SRTM).
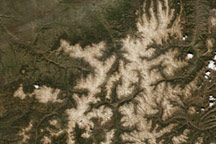
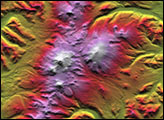
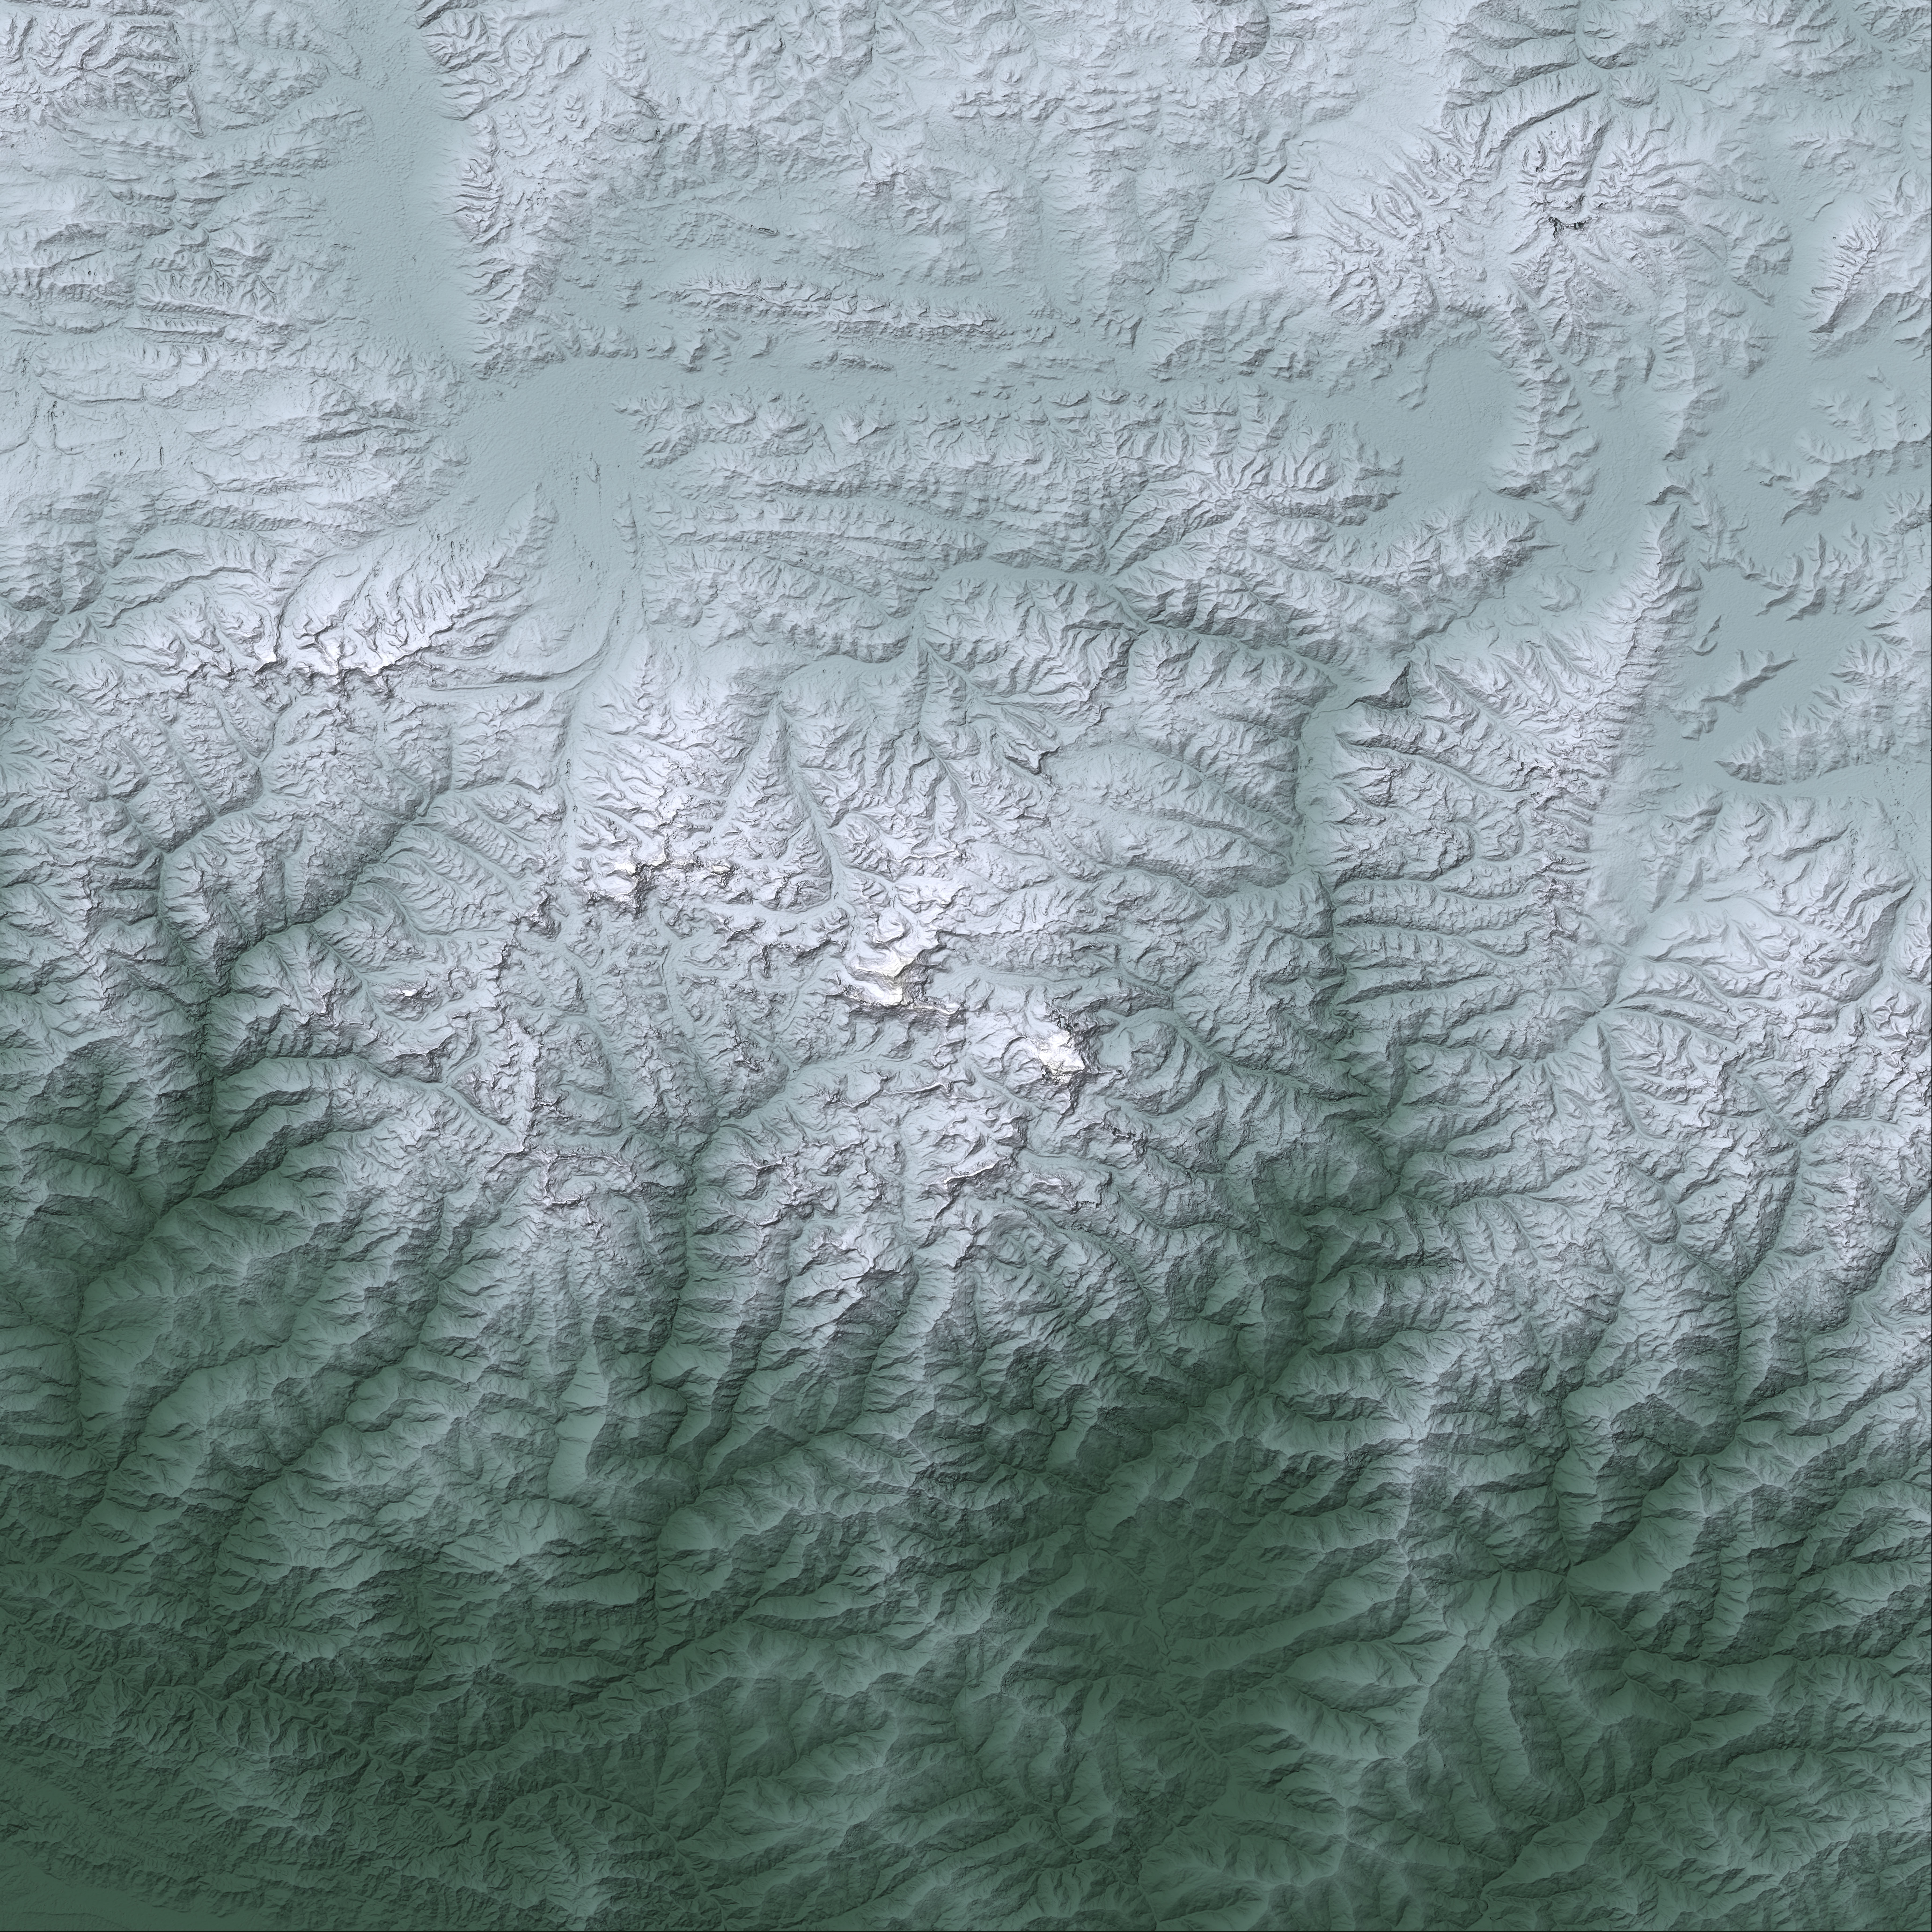
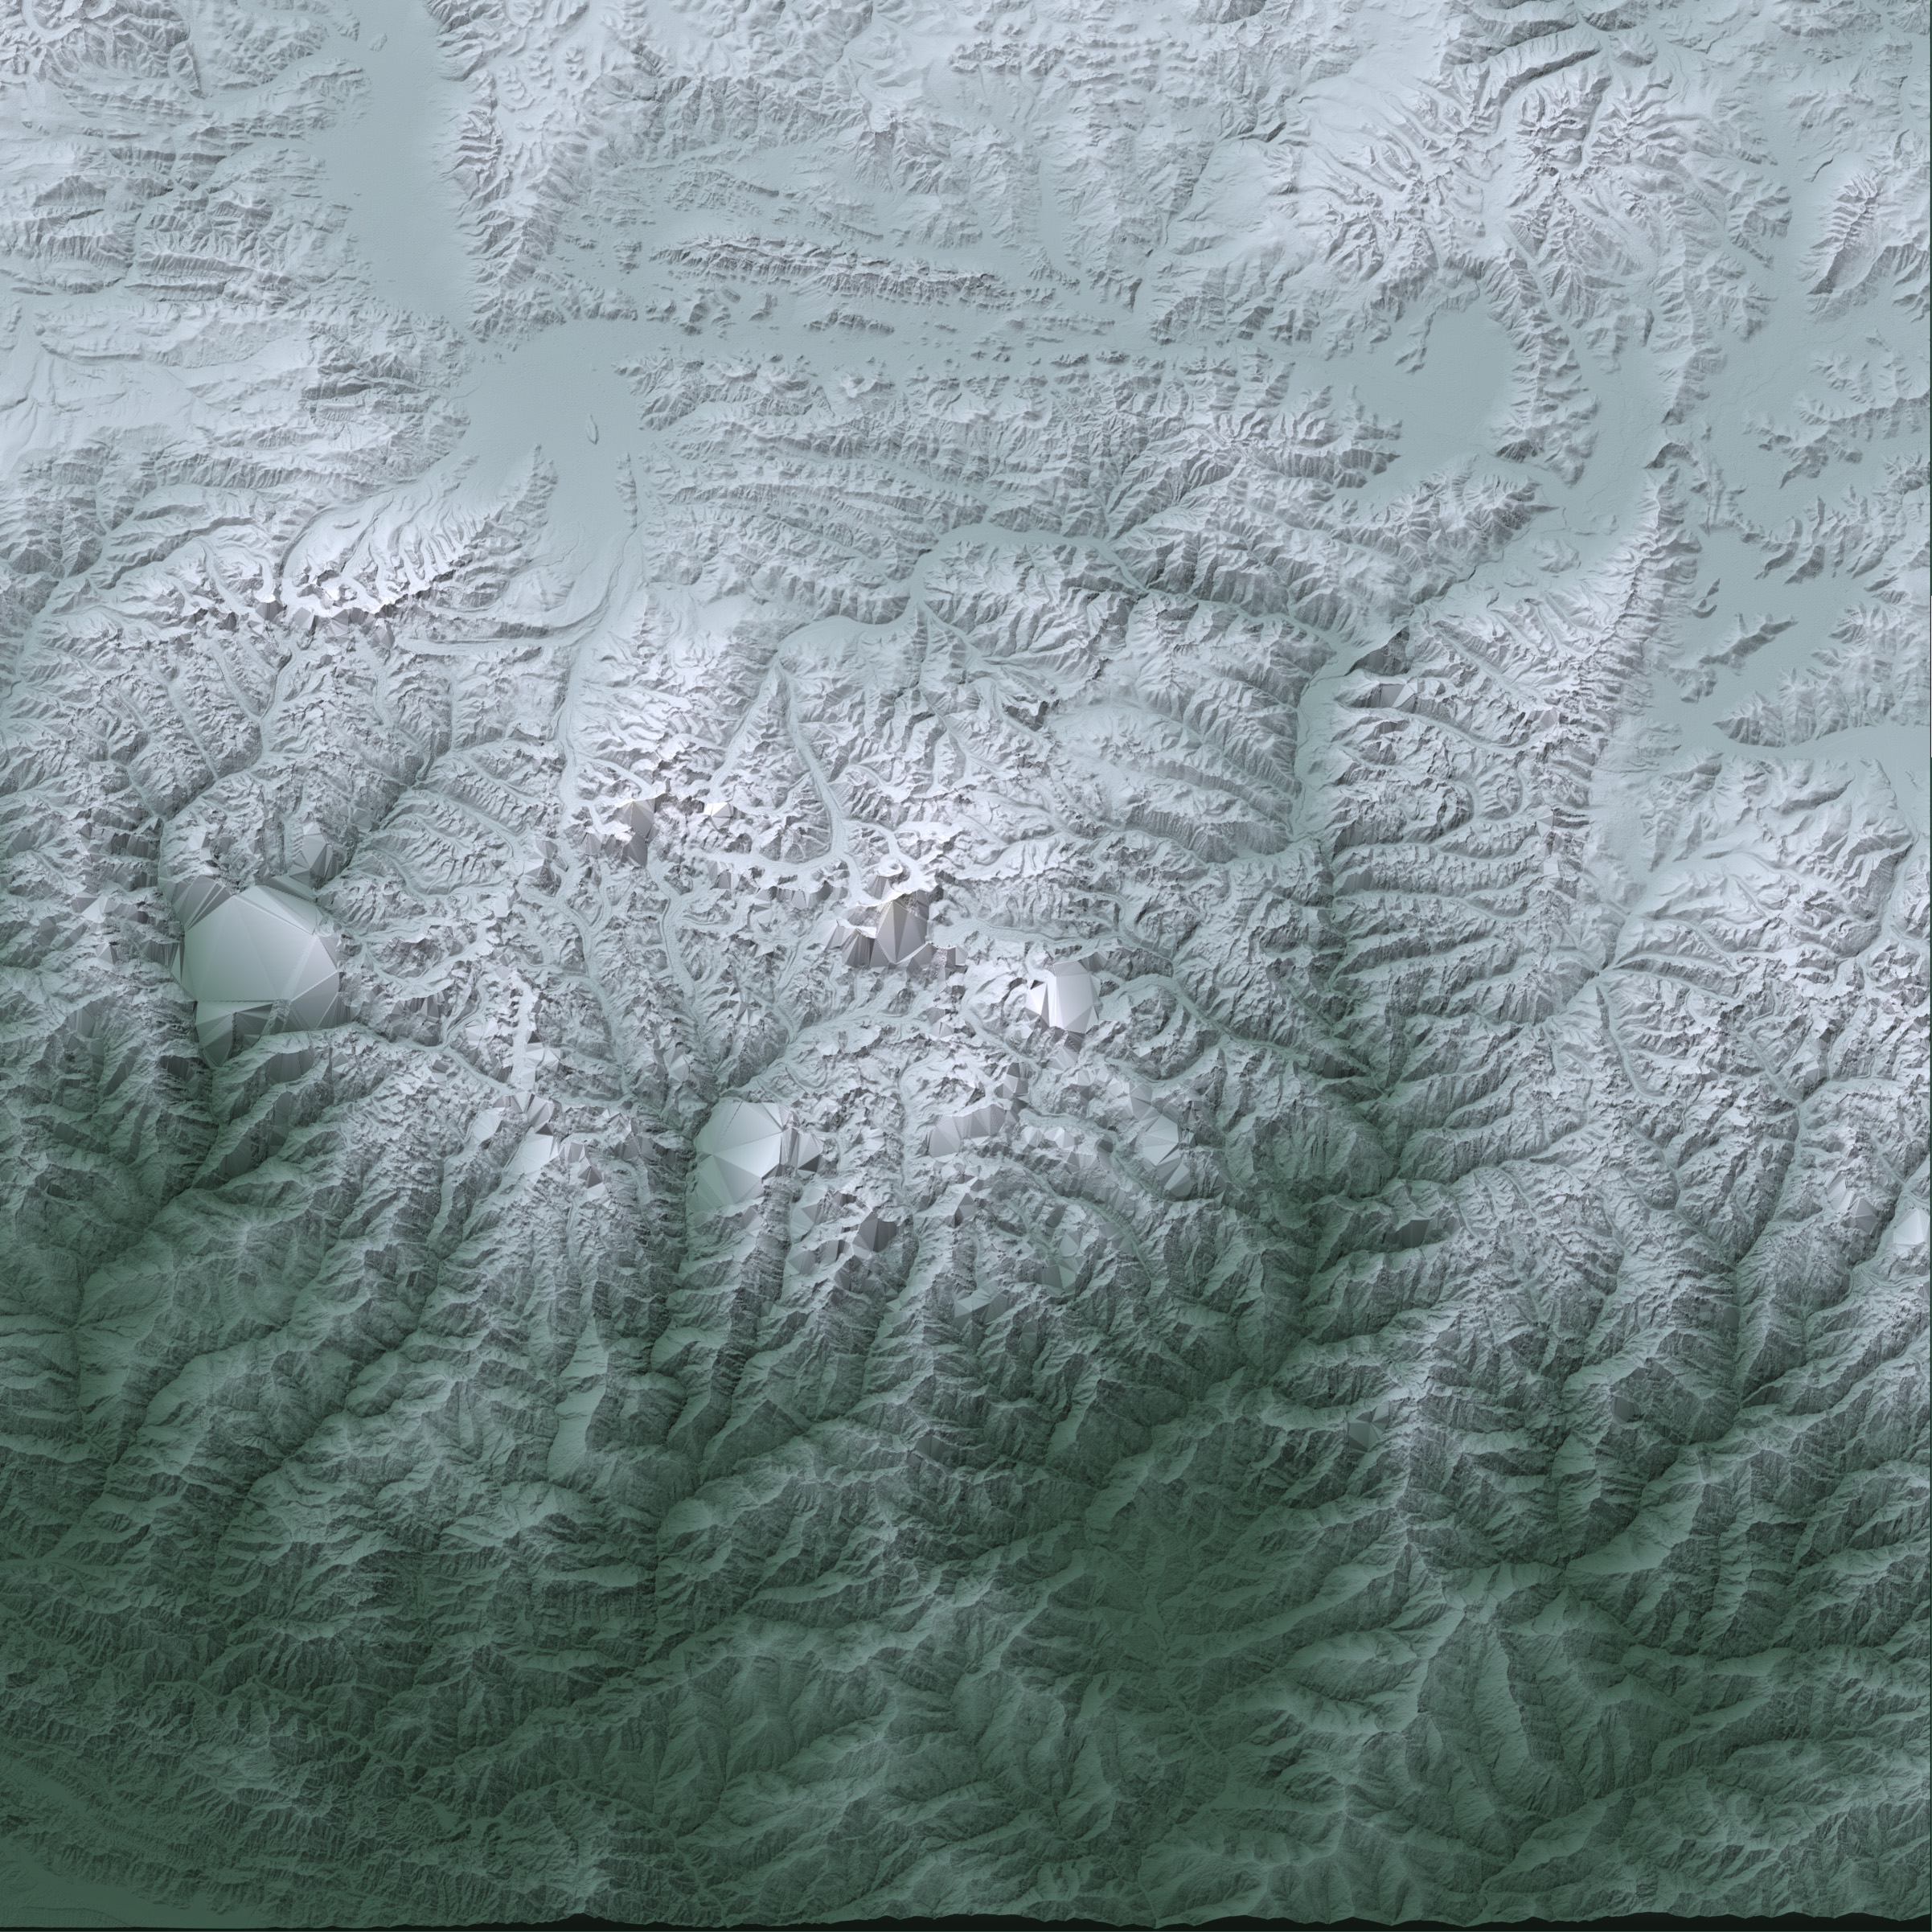
These images illustrate the differences between the two digital elevation models. The highest elevation areas are white, while lower elevations are gray and green. The towering peaks of the Himalaya Mountains provide an illustration of the strengths of the new model in measuring steep terrain, a task that challenged the SRTM model.
To create the SRTM map, scientists flew a radar on the space shuttle. By measuring the “echo” that returned after the radar waves bounced off the surface of the Earth, scientists were able to determine elevations. However, the technique did not work well in steep mountain regions, where the radar signal scattered. The results, shown in the lower image, were areas in which the elevation was poorly defined. Unnaturally smooth planes define Everest, Lhotse, and Makalu, the highest peaks in the region.
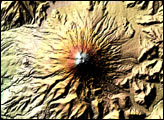
The ASTER model was made with reflected light. ASTER carries two telescopes used to record light from the Earth. The telescopes, says ASTER science team leader Mike Abrams, are like two human eyes. Our eyes see the world from two different angles, but we combine the two images for a three-dimensional view. To illustrate, close one eye, focus on a single word on the computer screen, and then switch to the other eye. You’ll see that the word on the screen seems to jump, while distant objects don’t. When we see with both eyes, our brains use the differences between what the left eye sees and what the right eye sees to gauge distance. Objects that are in different places are near, while seemingly stationary objects are far.
ASTER similarly records light from Earth using two different telescopes. Scientists used the differences between the two records to determine the ground elevation. Tall mountain peaks, like Everest, that are closer to the satellite, are displaced more than low valleys. Using this method, scientists created a digital elevation model that records changes in height with an average accuracy of 20 meters. The method works well most places, except areas that are cloudy most of the time (unlike the Shuttle Radar, ASTER cannot see through clouds) or regions of relatively featureless ice. In these cases, the SRTM elevation model provides a better picture where it exists. The SRTM model does not include land north of 60 degrees north latitude or south of 57 degrees south latitude. The ASTER model runs from 83 degrees north latitude to 83 degrees south latitude.
NASA images by Robert Simmon, based on ASTER and SRTM data. Caption by Holli Riebeek.