The combined effects of outdoor and household air pollution contribute to 6.7 million premature deaths every year, making air pollution one of the world’s leading risk factors for death and chronic diseases, according to the World Health Organization and the Institute for World Health Metrics and Evaluation. Yet for most people, especially in low- and middle-income countries, access to information about local air quality is often limited.
“I often see rankings of the ‘most polluted city’ in the world, but these sorts of rankings can be misleading,” said Randall Martin, an atmospheric scientist at Washington University in St. Louis. “The density of air quality monitors is so low globally that no one knows which city is most polluted in general, and even less so on a given day. Despite recent growth in ground-based monitors, millions of people still live in countries that either don’t collect high-quality air pollution data or don’t share it publicly.”
A team of NASA-funded researchers is trying to address the data shortage by developing a different way of tracking air pollution—a technique powered by satellite observations, modeling, and supercomputing. As part of an effort to make this approach more useful for cities in developing countries, the NASA team has partnered with the World Resources Institute (WRI) on a pilot project called CityAQ.
Most countries have limited or no access to expensive but accurate “reference” air quality monitoring stations to measure fine particulate matter (PM2.5) and other harmful pollutants such as nitrogen dioxide (NO2), ozone (O3), and sulfur dioxide (SO2). The lack of monitoring has consequences. A 2022 analysis of air pollution data shared by U.S. embassies in 40 countries found that cities given access to real-time air quality data saw significant drops in air pollution levels.
Even in large cities, the most reliable air quality monitors are scarce. By one estimate, there are 5,500 PM2.5 monitors for the world’s 1,700 cities with more than 300,000 or more people, an average of just three monitors per city. In sub-Saharan Africa, there is roughly one monitor for every 16 million people; in India, there is one monitor for every 7 million people.
To address the shortage, Christoph Keller and Emma Knowland and colleagues at NASA’s Global Modeling and Assimilation Office, Morgan State University, and Harvard University have developed a global model capable of hindcasting and forecasting the composition of the atmosphere, including several common air pollutants. The tool, Goddard Earth Observing System Composition Forecast (GEOS-CF), incorporates timely weather observations and insights from years of satellite observations, plus a range of historical emissions inventories. It generates five-day forecasts for the whole atmosphere every day.
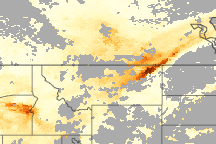
Example animations from GEOS-CF—showing the global distribution of ground-level PM2.5 and O3 for parts of September and October 2023—are shown above and below. During that period, major wildfires raged in Canada, large dust storms blew through the Sahara Desert and parts of South Asia, industrial pollution gathered over the Indo-Gangetic Plain and East Asia, and seasonal fires burned in South America and sub-Saharan Africa.
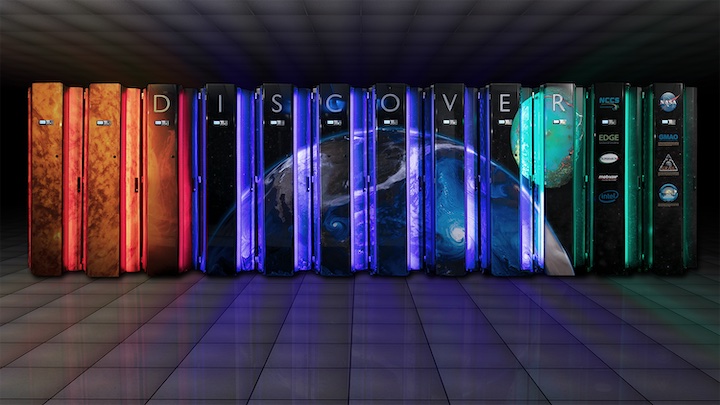
GEOS-CF is a version of a broader modeling and data assimilation system called the Goddard Earth Observing System (GEOS) that NASA scientists have used for meteorological and climate research for decades. The model calculates the concentration of air pollutants—as well as many other atmospheric constituents—in 25-square-kilometer grid boxes at 72 levels in the atmosphere from the surface to the stratosphere. As part of the forecasts, GEOS ingests millions of weather observations daily. It runs with the help of the Discover supercomputer at the NASA Center for Climate Simulation at Goddard Space Flight Center.
“The power of GEOS-CF is that we can use it to start filling in the gaps between ground monitors, making GEOS-CF a viable source of information for countries without much access to ground-based air quality monitoring,” Knowland said.
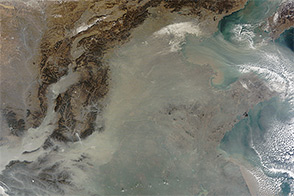
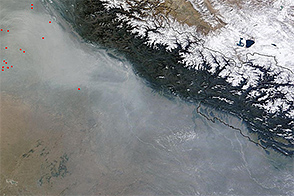
In GEOS-CF hindcasts and forecasts, Bogotá, Colombia, is encompassed by four of the 25-square-kilometer grid boxes. That’s enough spatial resolution for GEOS-CF to represent and forecast large, diffuse plumes of air pollution, such as the blankets of smoke that foul the city’s air when crop fires burn in the dry season of January and February.
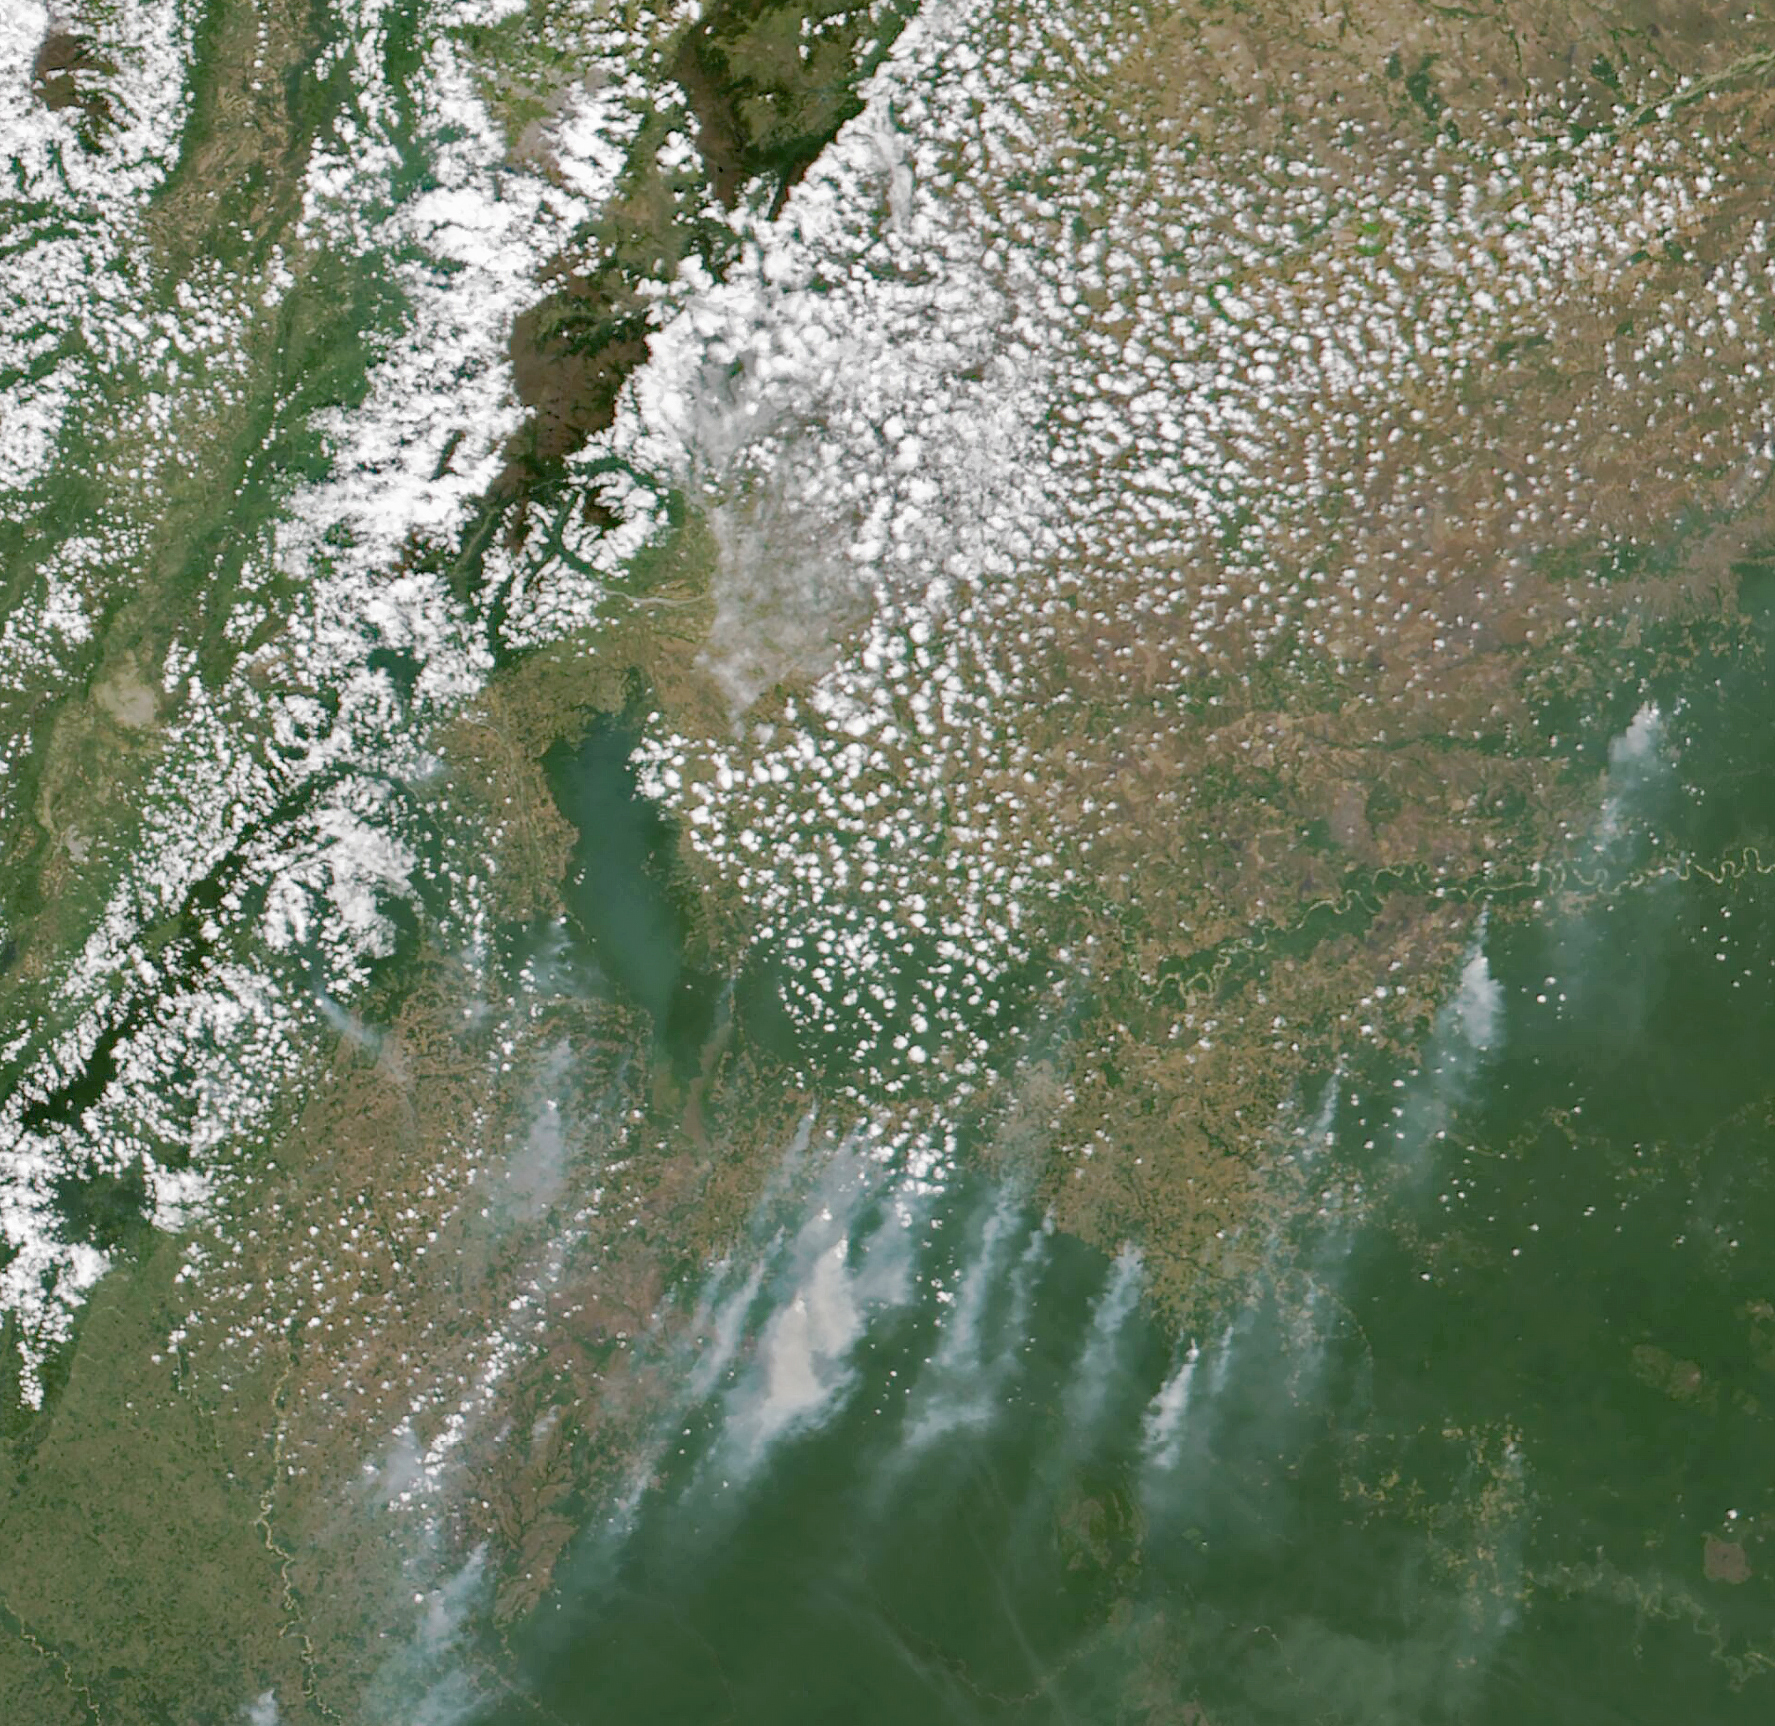
The image below, captured by the VIIRS (Visible Infrared Imaging Radiometer Suite) on the NASA-NOAA Suomi NPP satellite, shows an example of seasonal fires burning to the south and east of the city on January 28, 2022, before winds shifted and pushed smoke toward Bogotá.
However, the spatial resolution of data produced by GEOS-CF is not generally enough to offer useful information at the neighborhood, block, or street level, Keller explained. In some cases, cities need data at a few kilometers or less to properly assess things like the health risks of locating a school near a highway, or whether measures such as restricting traffic or encouraging the use of electric vehicles or bicycles are effective ways of reducing pollution.
To produce more localized and tailored air quality monitoring information for specific cities and neighborhoods, the NASA team and WRI launched the CityAQ project in 2020. It works by absorbing even sparse ground and air monitoring data and using a machine-learning technique that improves the accuracy of GEOS-CF model output. As part of the project, WRI worked with eight cities to share data with NASA from ground monitors: Addis Ababa, Ethiopia; Jakarta, Indonesia; Kigali, Rwanda; Leon-Salamanca-Celaya Metro, Mexico; Monterrey Metro, Mexico; Guadalajara Metro, Mexico; Sao Paulo, Brazil; and Bogotá, Colombia.
“Once we started to train the model with ground data, we began to get even better forecasts,” Keller said. The model output was made available through NASA’s Global Modeling and Assimilation Office website and WRI’s Resource Watch browser. Some cities, like Monterrey and Bogotá, also began to host CityAQ data on city websites.
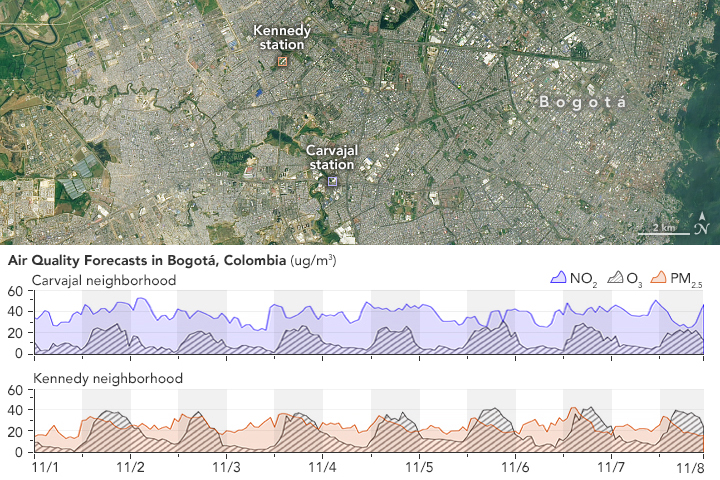
The chart at the top of the page shows an example of CityAQ forecasts for nitrogen dioxide and ozone that was issued on November 4, 2023, after the model was trained using information from Bogotá’s Carvajal neighborhood. Given that instrument’s placement near a large highway and industrial sites, it typically records the highest annual NO2 concentration of any monitoring station in the city and regularly exceeds World Health Organization standards for both NO2 and PM2.5. The second chart shows ozone (O3) and PM2.5 output for the nearby Kennedy neighborhood.
In both cases, the model accurately captured the concentrations of pollutants and captured subtle nightly peaks that showcase the accuracy of the model output, Keller said. The model output became accurate enough that Bogotá added CityAQ data to the mix of tools it uses to develop air quality warnings for the city’s 7 million residents.
However, Bogotá had more robust ground data than several other CityAQ pilot cities, making it easier for the NASA team to improve the GEOS-CF forecasts. Researchers are currently retooling the effort to find new ways to integrate observations from low-cost air quality sensors—sometimes the only option in developing countries—into the GEOS-CF forecasts. Low-cost sensors are easier to operate and cost a few hundred to a few thousand US dollars each, while reference monitoring stations often cost upwards of $10,000 each and require people with expertise in calibration and data interpretation.
As part of a new effort that began in 2021, the World Resources Institute, the Clean Air Fund, and other partners are developing a system called CanAIRy that will fine-tune outputs from GEOS-CF with air quality monitoring data from both reference monitoring stations and low-cost sensor networks.
“CanAIRy Alert incorporates air quality forecasts generated for cities as part of the CityAQ project and added cities like Kigali, Rwanda; Nairobi, Kenya; Kampala, Uganda; and Accra, Ghana,” said Beatriz Cardenas, WRI’s global director for air quality. “But we’re in the process of recruiting more cities and building up communities of practice to share information about how to access and make use of the tools. Our goal is to register many more cities.”
NASA Earth Observatory image by Michala Garrison, using data from NASA’s Global Modeling and Assimilation Office and the World Resources Institute’s CityAQ initiative. Videos by Joseph Ardizzone and Katie Jepson, courtesy of NASA’s Scientific Visualization Studio. Supercomputer photograph courtesy of the NASA Center for Climate Simulation. Story by Adam Voiland.