Wildland fire experts have described Canada’s 2023 fire season as record-breaking and shocking. Over the course of a fire season that started early and ended late, blazes have burned an estimated 18.4 million hectares—an area roughly the size of North Dakota. On average, just 2.5 million hectares burn in Canada each year.
While the total number of reported fires has not been unusual—6,595 by October—a subset of the fires reached extraordinary sizes. Hundreds of fires exceeded 10,000 hectares (39 square miles), large enough to be considered “megafires.” These megafires were also unusually widespread this season, charring forests from British Columbia and Alberta in the west to Quebec and the Atlantic provinces in the east to the Northwest Territories and the Yukon in the north.
As the fires raged, NASA scientists tracked them with a new system—the Fire Events Data Suite (FEDS). The system draws upon NOAA and NASA satellite data to provide more frequent monitoring of fire activity, growth, and behavior than has been available in the past. The system, pioneered by researchers at the University of California, Irvine, and NASA’s Goddard Space Flight Center, draws on data from sensors aboard the Suomi NPP and the NOAA-20 satellites called VIIRS (Visible Infrared Imaging Radiometer Suite).
VIIRS identifies active fires during the day and night by detecting their thermal infrared energy. The sensor is carried by multiple satellites—each capable of observing the entire planet every 12 hours—allowing the FEDS system to quickly absorb new information about the location and intensity of fires. The system can then generate maps of individual fires’ perimeters, revealing how a fire changes over time and the total area it has burned.
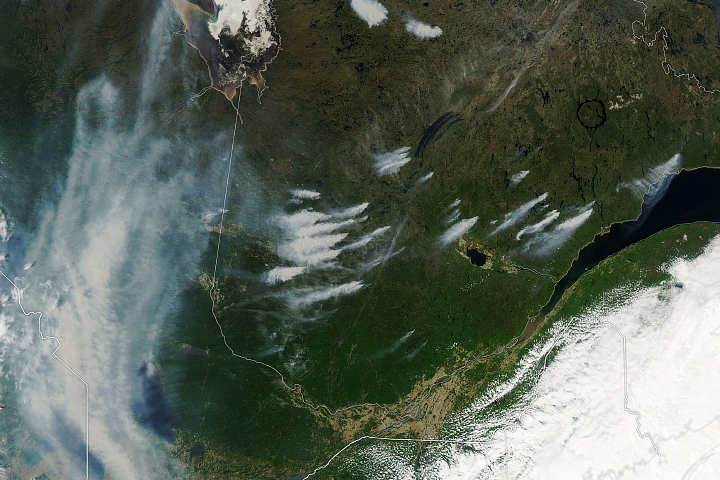
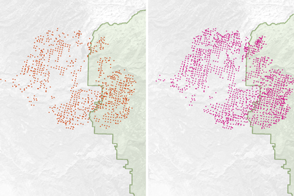
Many of Canada’s fires in 2023, ignited by summer lightning storms, burned for months in remote areas. The animation above shows the largest Canadian fire in the FEDS database for 2023 as of September 19, 2023—a fire that had charred 1,224,938 hectares (4,730 square miles) in Quebec near the La Grande Reservoir 3. The fire stopped spreading in late July, around the time of the last frame shown in the animation. The expanding dark gray areas show the perimeters’ growth in 12-hour increments since June 1.
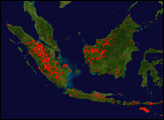
The second-largest fire as of September 19, 2023 (below), raged throughout much of June and July near Fort Nelson, where the borders of British Columbia, the Northwest Territories, and Alberta intersect. It stopped spreading for a time in August after charring 802,575 hectares as of September. Late in September and October, winds reinvigorated the fire and it grew rapidly to become the largest fire of the year. The other three largest fires in the database as of September 19 (visible below), charred parts of Northwest Territories, Alberta, and Saskatchewan.
“The thing that really sets FEDS apart is that the system excels at tracking the daily, incremental spread of fires at 12-hour intervals,” said Yang Chen, an atmospheric scientist at the University of California, Irvine. “That makes near real-time monitoring possible and allows us to generate much more detailed views of fire progression than we have been able to do in the past.”
Sensors on an earlier generation of satellites called MODIS (Moderate Resolution Imaging Spectroradiometer), first launched in 1999, have coarser spatial resolution that limit their ability to track a fire’s behavior. Data from sensors on Landsat satellites, which have been in orbit since the 1970s, can also be used to identify active fires and map fire perimeters, but there are often lengthy gaps—up to 16 days—between Landsat observations of a certain fire.
More frequent maps of fire perimeters open an array of new research possibilities and practical applications. “The FEDS system could help fire crews pinpoint the parts of a fire perimeter that are actively burning and might need attention—especially in remote areas where monitoring by aircraft or other means is limited,” said Douglas Morton of the Biospheric Sciences Laboratory at NASA’s Goddard Space Flight Center. “It could also help fire crews identify areas of residual heat behind the main fire front that may pose a hazard for fire crews on the ground.”
The FEDS system also offers a trove of information that could help advance scientists’ understanding of fire. For example, how do factors such as vegetation type, terrain, weather conditions, and firefighting tactics affect the rate that fires spread and the volume of emissions they produce? And how does the interplay between localized factors and larger scale shifts in the climate affect fire behavior?
Ignited by lightning on June 1, the fire in Quebec saw surging growth in late June and early July, a period when temperatures were unusually high and drought gripped the region. “The great thing about FEDS is that we can really dig into and study how several individual factors affect fire spread,” said Tempest McCabe, a scientist at NASA’s Goddard Space Flight Center. “We’re in the process of doing that now for several of the fires in Canada—as well as other major fire events around the world that have happened in recent years.”
Meanwhile, Chen and colleagues recently used FEDS data in their analysis of hundreds of large fires that occurred in California between 2012 and 2020. “We saw a lot of interesting patterns,” said Chen. “Many of those fires showed quite uneven growth overall, with explosive rates of growth occurring during the first several days after ignition.” Understanding what drives this explosive growth can help refine risk models for future fires in an increasingly flammable world.
As of late October 2023, Canada’s remarkable fire season was finally slowing down. Dozens of fires were still out of control on October 24, but winter weather is expected to suppress most of them. However, even winter may not be enough in some cases. Previous research shows that overwintering “zombie” fires in this region have increasingly begun to smolder underground throughout the winter and remerge in the spring as temperatures rise.
NASA Earth Observatory animations by Michala Garrison, using Fire Events Data Suite (FEDS) data on fire movement and severity by ingesting thermal observations from VIIRS from NASA EOSDIS LANCE, GIBS/Worldview, and the Joint Polar Satellite System (JPSS) and NASA EOSDIS LANCE, GIBS/Worldview, and the Suomi National Polar-orbiting Partnership. The FEDS algorithm is based on Chen, Yang, et al. (2022), data for Canada provided by NASA’s Earth Information System (EIS) Project. Basemaps include MODIS data from NASA EOSDIS LANCE and GIBS/Worldview. Story by Adam Voiland.