Mariners have long called the turbulent seas south of the Cape of Good Hope the “Roaring Forties” and “Furious Fifties.” Fierce westerly winds and frequent storms roil the waters between 40 and 60 degrees south of the equator.
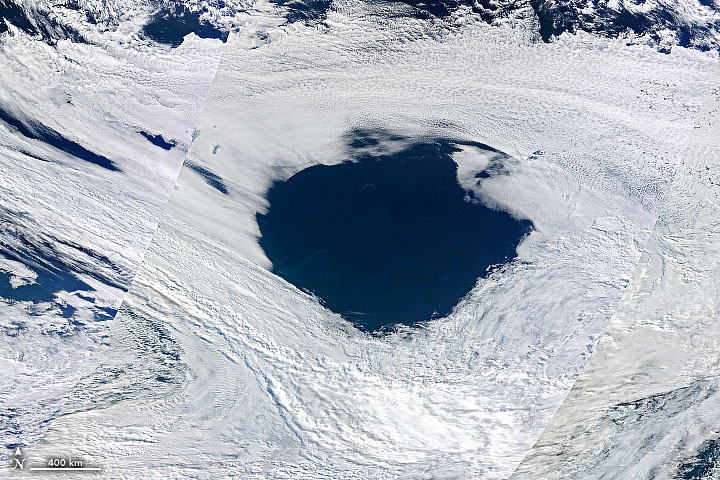
But even this area occasionally gets a break from the weather. On April 3, 2022, the Moderate Resolution Imaging Spectroradiometer (MODIS) on NASA’s Terra satellite happened to be in the right position to spot what appears to be a massive “hole” in the clouds. (MODIS collects data in viewing swaths that are 2,330 kilometers (1,450 miles) wide; the diagonal lines in the natural-color image above are the edges of those swaths.)
“There are actually a few things coming together to make it appear like one connected feature,” explained Gary Partyka, an atmospheric scientist at NASA’s Goddard Space Flight Center. By analyzing sea level pressure maps and other data from a NASA weather model called the GEOS Forward Processing system, Partyka worked out what was going on.
“It looks like there was a frontal weather system zipping by from west-to-east between 50-60 degrees south latitude. At the same time, a deck of more stationary, low clouds closer to the tip of Africa was being eroded by a high-pressure region with sinking air,” Partyka explained. “The sinking air produced a semi-circle ring of clouds between 45-50 degrees south. When both of these phenomena lined up in longitude, it gave the appearance of a giant hole in the clouds.”
Winds generally blow outward and away from high-pressure systems, which are typically cooler and denser than surrounding air masses and pull air downward in a spiraling motion, explained Abdullah Fahad, a NASA atmospheric scientist who specialized in high-pressure systems as a doctoral student. As air in a high (sometimes called an anticyclone) sinks, it also warms, increasing the rate of evaporation and making it difficult for the air to sustain clouds. Areas of low pressure, by contrast, pull air upward and generate clouds and stormy weather.
“This is a really interesting case,” said Fahad. “Keep in mind this is happening in the Southern Hemisphere’s ‘storm tracks’ region, which has regular cyclonic activity, low atmospheric pressures, and high westerly wind speeds most of the time. Seeing a high-pressure system and an anticyclone with the opposite circulation is actually an anomaly for this area.”
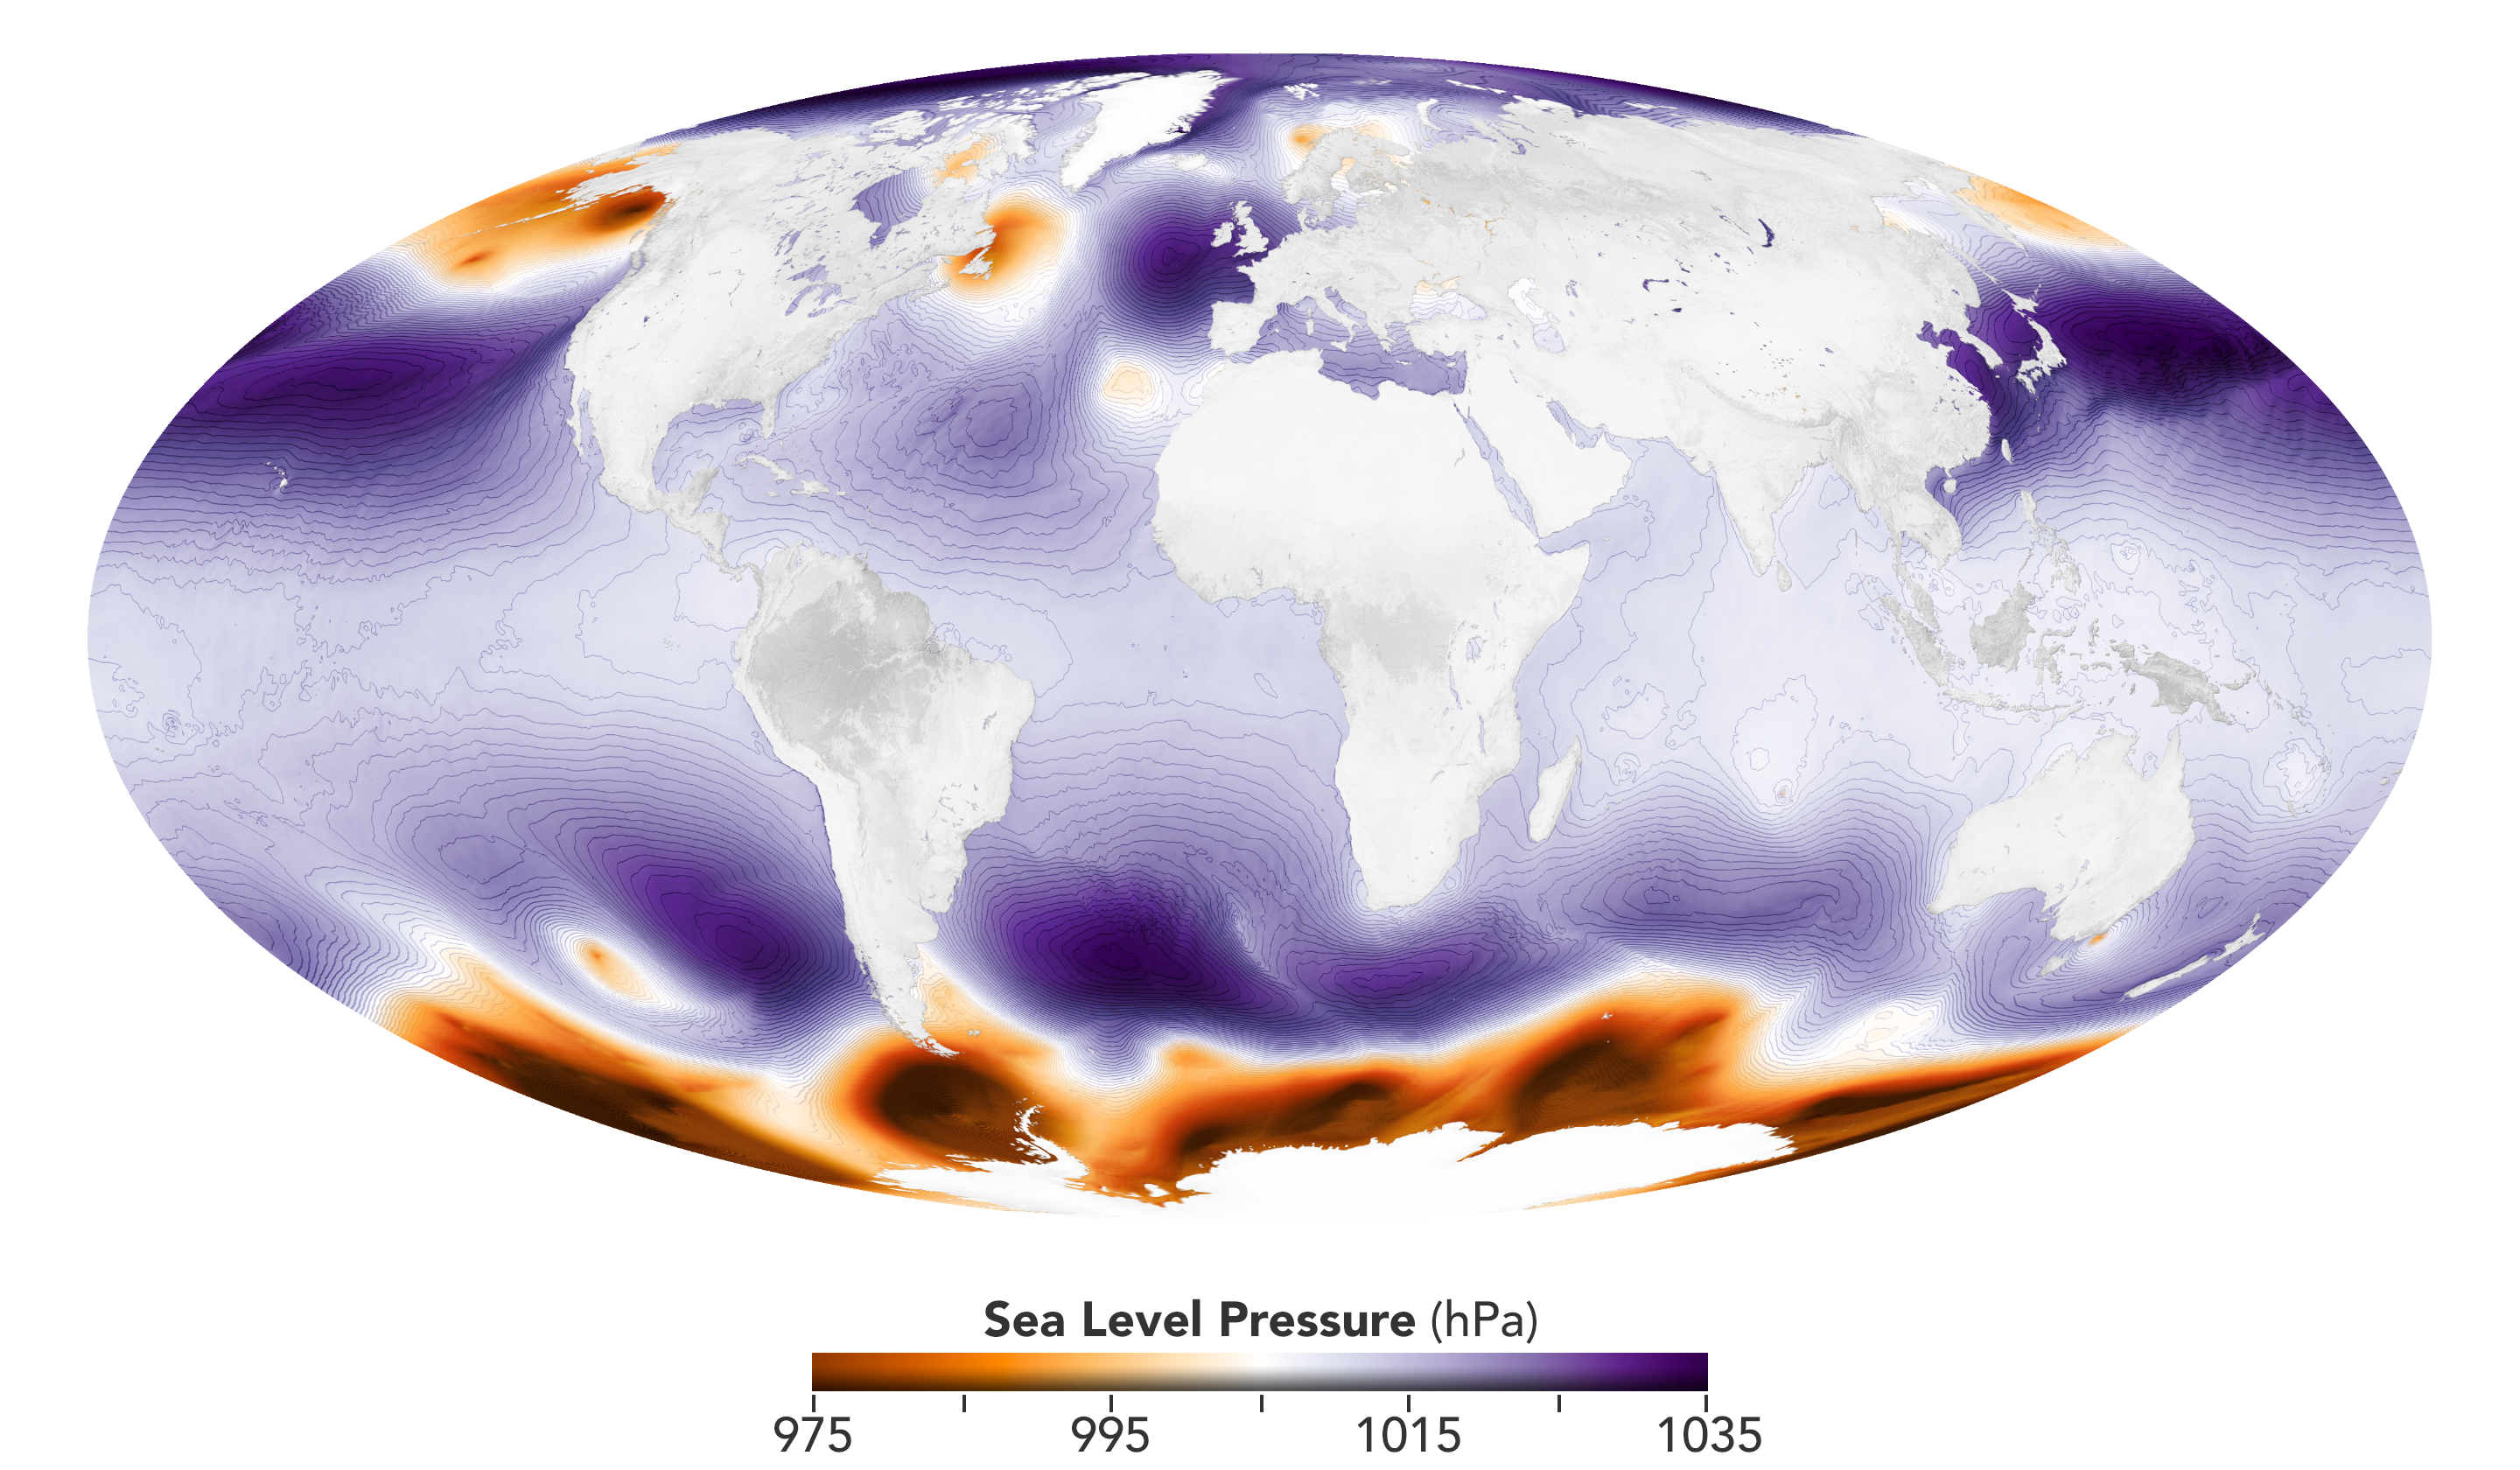
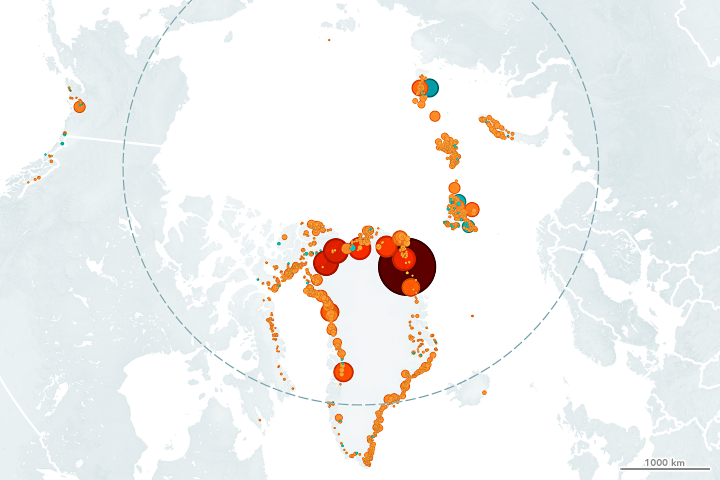
The global map above shows the position of the high-pressure area on April 3, 2022, about 90 minutes before the MODIS image of the cloud “hole” was acquired. Globally, the average sea-level pressure is about 1013 millibars; at the center of the high, pressures topped 1,035 millibars. Stormy, low-pressure areas appear orange; calmer, high-pressure areas are purple.
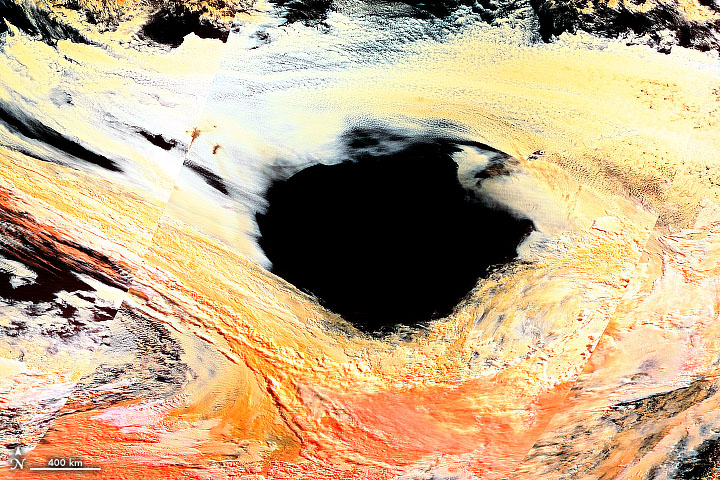
“One of the giveaways for me that this isn’t one circular cloud feature is that I can tell that the frontal clouds are at a higher altitude than the deck of low clouds being eroded to the north by looking beyond natural-color imagery,” said Partyka. “MODIS just happened to get a very fortuitous pass when both lined up at the right time.”
The false-color image (MODIS bands 3-6-7) above helps illustrate this. With that combination of blue and shortwave infrared light, the low clouds in the northern half of the feature appear mostly white, indicating they are comprised of liquid droplets close to the surface. In contrast, the frontal clouds in the southern half of the feature appear red, a sign that they contain large numbers of ice particles that are higher in the air.
NASA Earth Observatory images by Joshua Stevens, using MODIS data from NASA EOSDIS LANCE and GIBS/Worldview, and GEOS-5 data from the Global Modeling and Assimilation Office at NASA GSFC. Story by Adam Voiland.
Image of the Day Atmosphere Remote Sensing
A high-pressure region combined with a passing frontal system off the South African coast to create an eye-catching gap in the clouds.
Image of the Day for April 9, 2022
View more Images of the Day:

alert message