The Earth Observatory has published its last Image of the Day on this website. Please join us on our new home at science.nasa.gov/earth/earth-observatory.
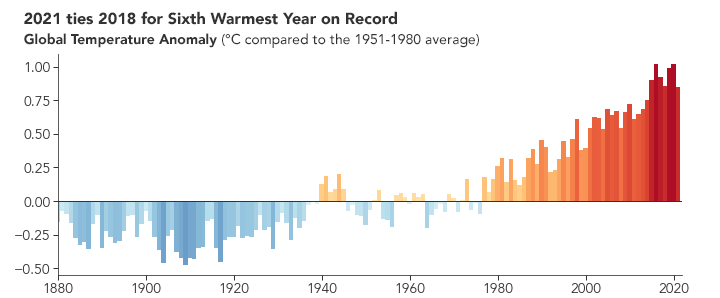
Earth’s global average surface temperature in 2021 tied 2018 as the sixth-warmest year on record, according to independent analyses from NASA and the National Oceanic and Atmospheric Administration (NOAA).
Global temperatures in 2021 were 0.85 degrees Celsius (1.5 degrees Fahrenheit) above the average for NASA’s baseline period, according to scientists at NASA’s Goddard Institute for Space Studies (GISS). NASA uses the period from 1951-1980 as a baseline to compare how global temperatures change over time.
Collectively, the past eight years have been the warmest since modern recordkeeping began in 1880. This annual temperature data is part of the global temperature record that tells scientists how much and where our planet has been warming. Earth in 2021 was about 1.1°C (1.9°F) warmer than it was in the late 19th century, when the Industrial Revolution was underway and weather stations were popping up around the world.
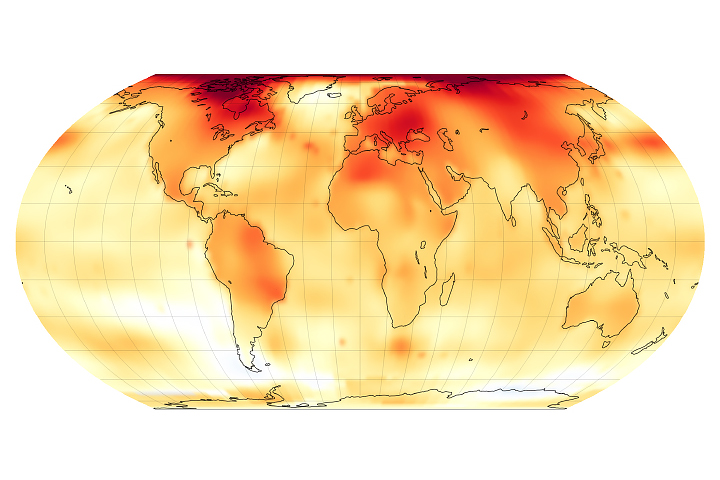
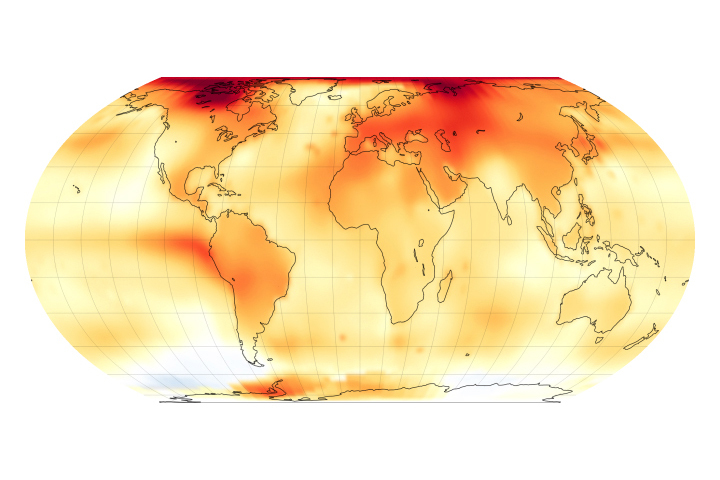
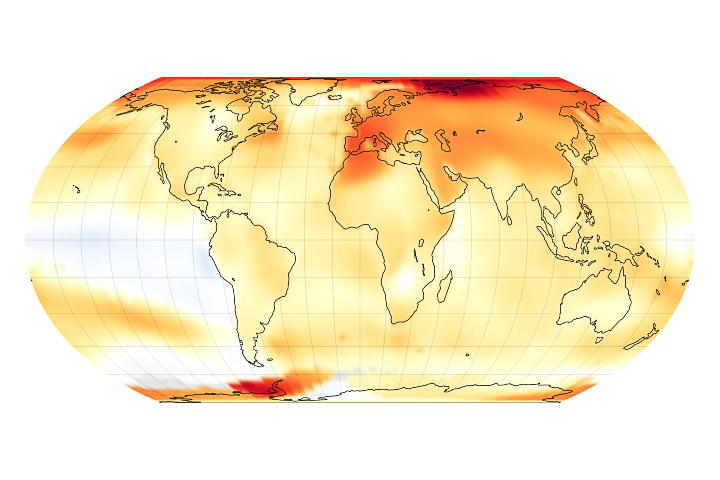
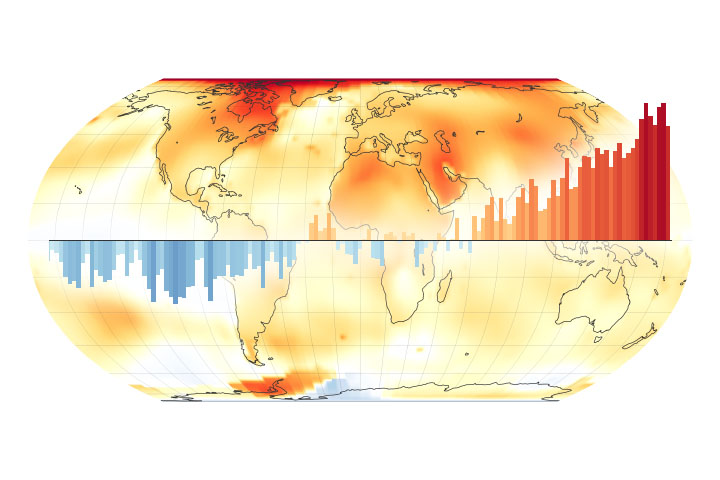
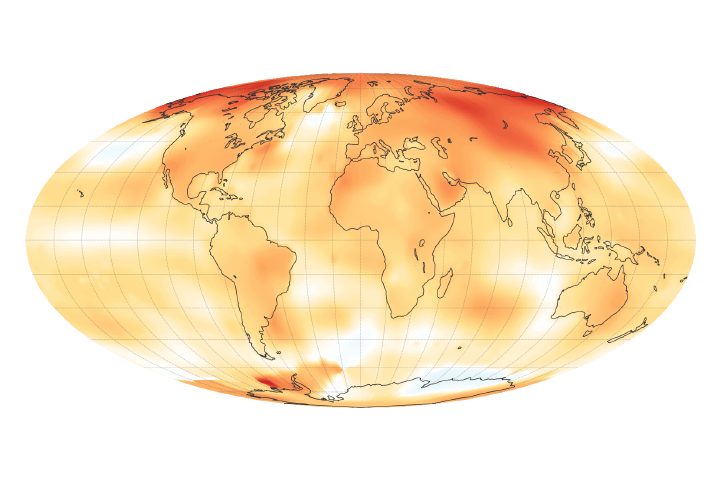
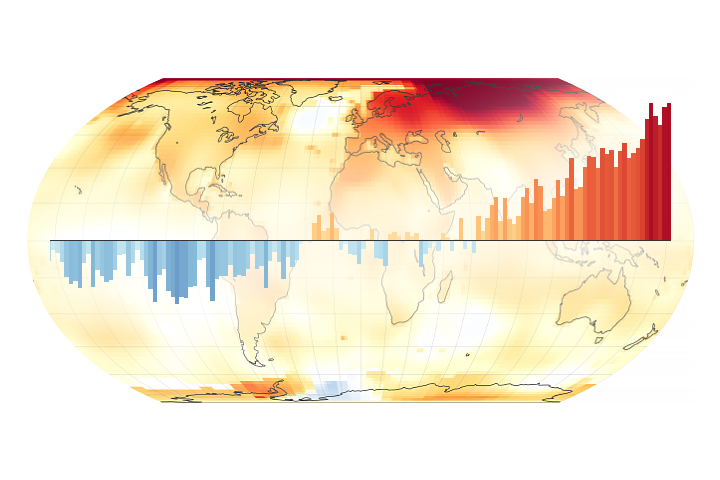
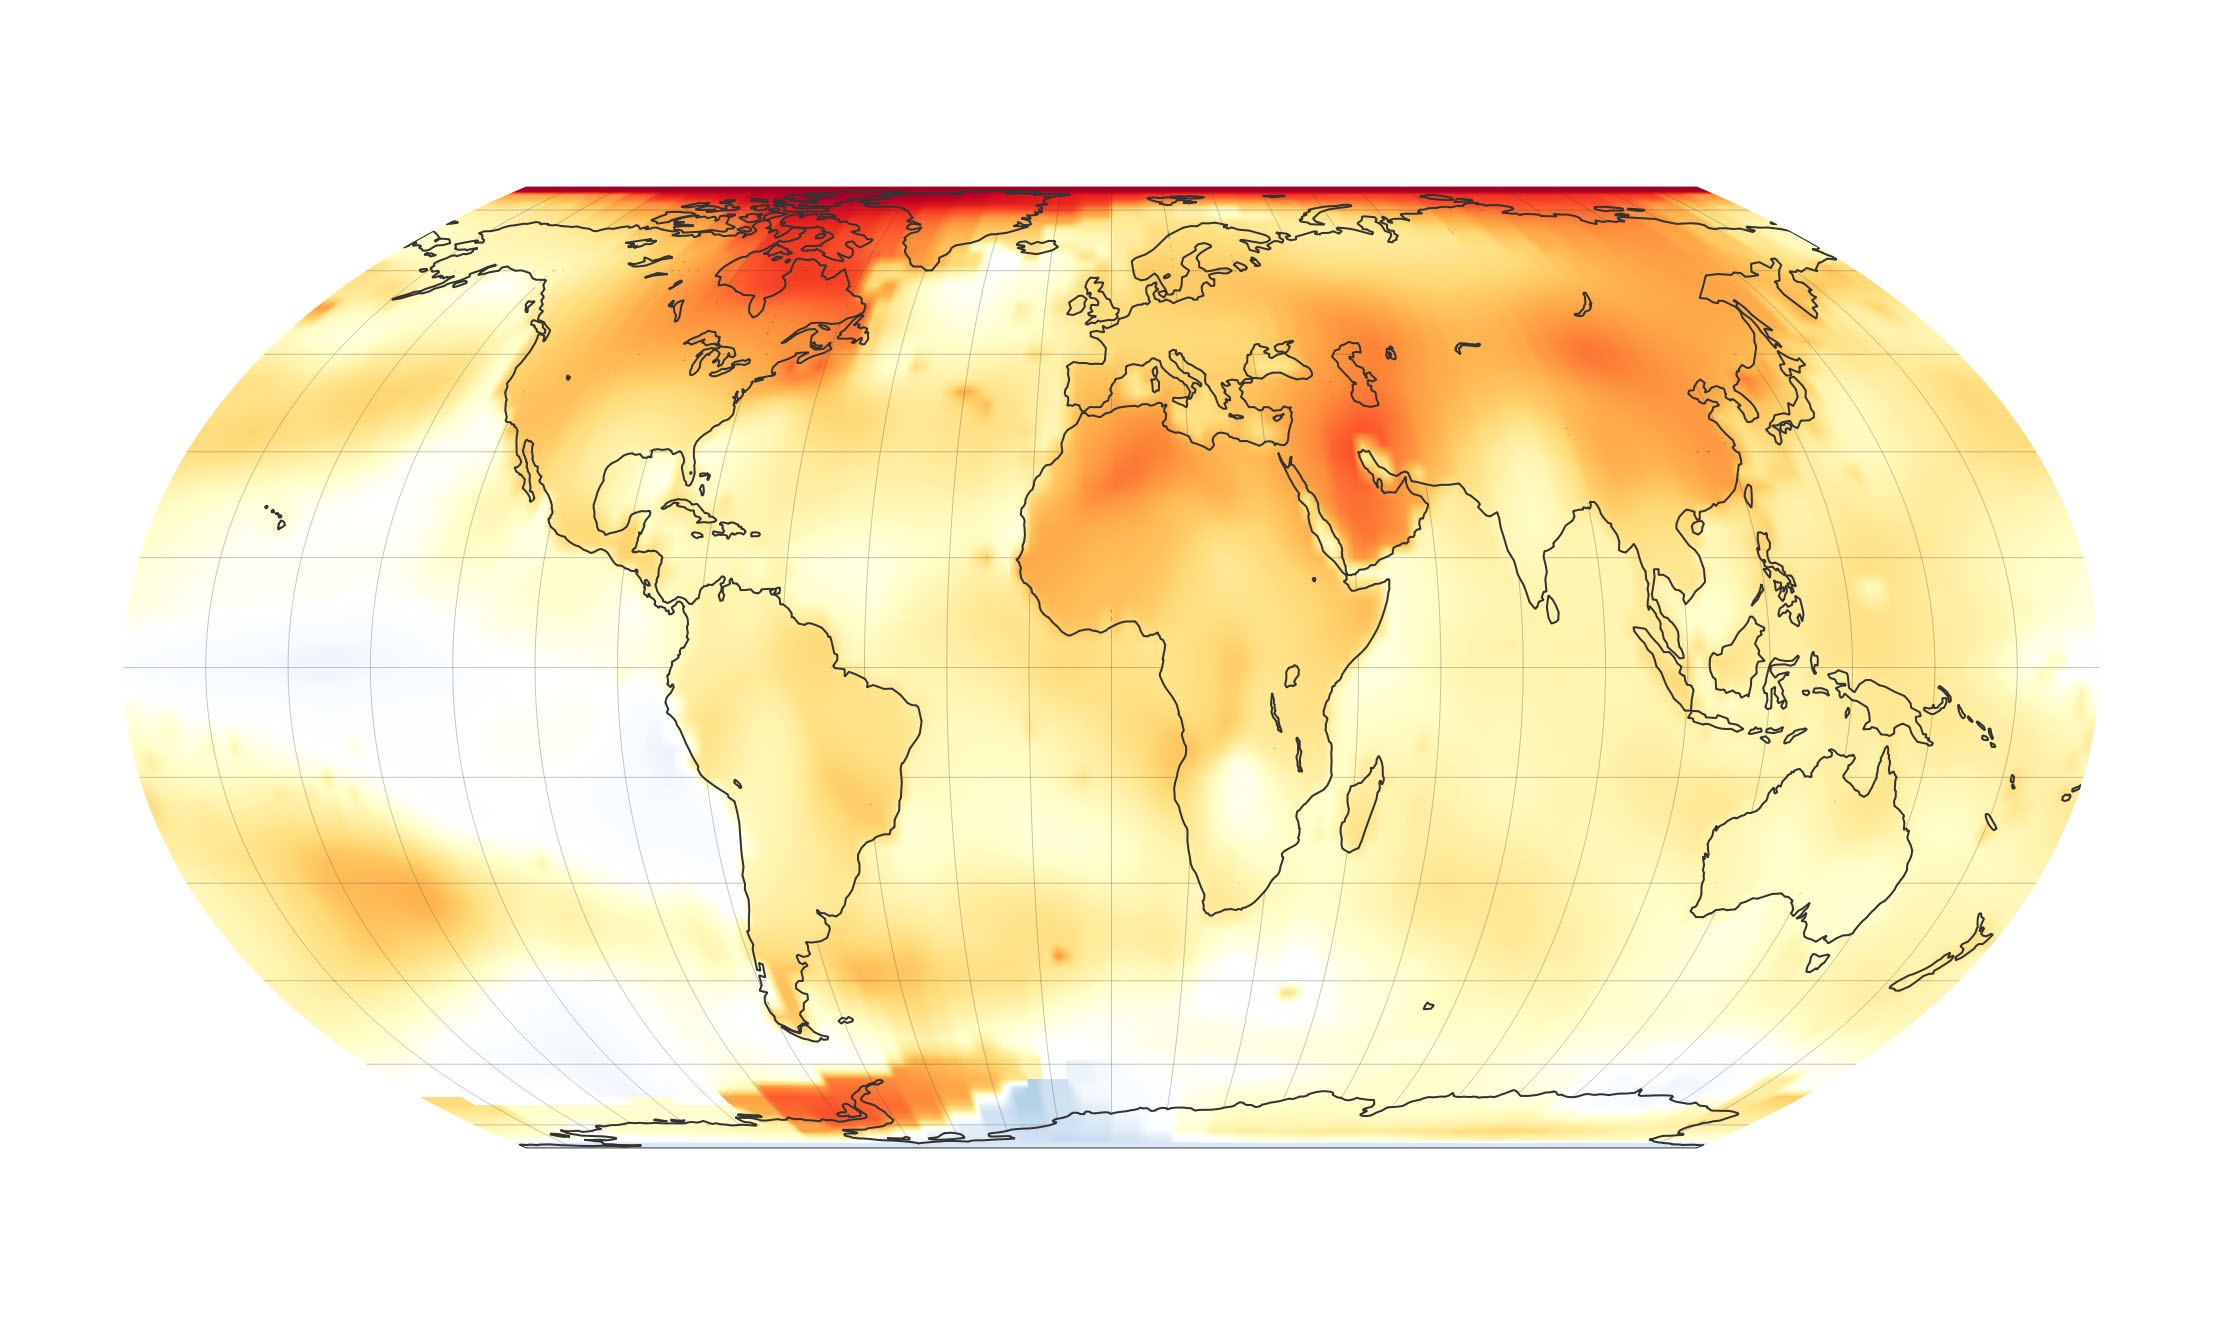
The map above depicts global temperature anomalies in 2021. It does not show absolute temperatures; instead, it shows how much warmer or cooler each region of Earth was compared to the average from 1951 to 1980. The bar chart below shows 2021 in the context of the past 140 years. The values represent surface temperatures averaged over the entire globe for the year.
The long-term global warming trend is largely due to human activities that have increased emissions of carbon dioxide and other greenhouse gases into the atmosphere. The planet is already seeing the effects of global warming: Arctic sea ice is declining, sea levels are rising, and wildfires are becoming more severe. Understanding how the planet is changing—and how rapidly those changes are occurring—is crucial for preparing humanity to adapt to a warmer future.
NASA’s temperature analyses incorporate surface temperature measurements from more than 20,000 weather stations, ship- and buoy-based observations of sea surface temperatures, and temperature measurements from Antarctic research stations. These in situ, ground-based measurements are validated with satellite data from the Atmospheric Infrared Sounder (AIRS) on NASA’s Aqua satellite. The data are also analyzed using an algorithm that considers the varied spacing of temperature stations around the globe and urban heat island effects. The full dataset of global surface temperatures for 2021, as well as details of how NASA scientists conducted the analysis, are publicly available from GISS.
A separate, independent analysis by NOAA also concluded that the global surface temperature for 2021 was the sixth highest on record. NOAA scientists use much of the same raw temperature data in their analysis, but they have a different baseline period (1901-2000) and methodology.
“The complexity of the various analyses does not matter because the signals are so strong,” said Gavin Schmidt, director of GISS, NASA’s leading center for climate modeling and climate change research. “The trends are all the same because the trends are so large.”
Many factors affect the average temperature in any given year, including La Niña and El Niño climate patterns in the tropical Pacific. 2021 was a La Niña year, and NASA scientists estimate that those ocean conditions may have cooled global temperatures by about 0.03°C (0.06°F) from what the average might have been.
“Science leaves no room for doubt: Climate change is the existential threat of our time,” said NASA Administrator Bill Nelson. “Eight of the top 10 warmest years on our planet occurred in the last decade, an indisputable fact that underscores the need for bold action to safeguard the future of our country and all of humanity.”
NASA Earth Observatory images by Joshua Stevens, based on data from the NASA Goddard Institute for Space Studies. Story by Sofie Bates, NASA’s Earth Science News Team, with Michael Carlowicz.