

The amount of sea ice around Earth’s poles waxes and wanes with the seasons, melting through spring and summer and growing through fall and winter. In recent decades, there has been more waning than waxing, as polar sea ice has mostly been in a long-term decline since the start of the satellite record in the 1970s. The maps on this page represent the most recent snapshots of those annual highs and lows.
“The 2020-2021 Arctic data further confirm that the Arctic sea ice coverage is well below what it had been in the 1970s and 1980s,” said Claire Parkinson, a sea ice scientist at NASA’s Goddard Space Flight Center. “The 2020–2021 Antarctic data reveal an ice cover that has rebounded somewhat from its 2017 record low but is nowhere close to growing back to its much greater 2014 ice coverage.”
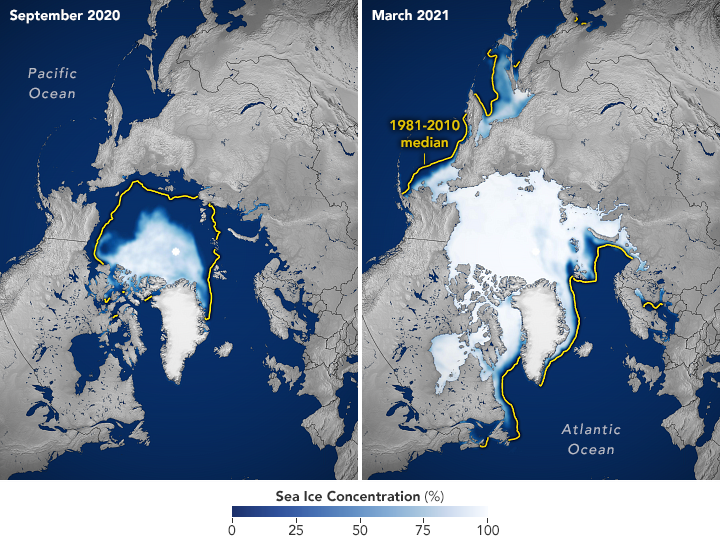
The maps above show the average Arctic sea ice extent for September 2020 (left) and March 2021 (right), the months in which the region reaches its annual minimum and maximum ice extents. Sea ice extent is defined as the total area in which the ice concentration is at least 15 percent.

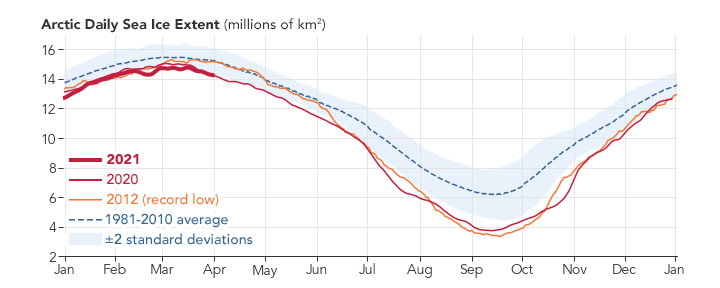
When Arctic sea ice reached its minimum extent on September 15, 2020, it spanned just 3.74 million square kilometers (1.44 million square miles)—the second-lowest minimum since the start of the satellite record in 1979. In recent decades, Arctic melting seasons have been growing longer and much of the older, thicker ice has been lost.
This winter’s annual ice maximum was less noteworthy. Ice formed throughout autumn and winter and reached its maximum on March 21, 2021. The extent was measured at 14.77 million square kilometers (5.70 million square miles), well below the 1981-2010 average of 15.64 million square kilometers. March 2021 was the seventh-lowest Arctic ice maximum in the 43-year satellite record.
Some Arctic marginal seas fared worse than others. In the Labrador Sea, sparse sea ice cover during the winter posed challenges for Inuit people, disrupting some ice highways that connect communities in the region. In the Gulf of Saint Lawrence, the lack of sea ice led seal pups to cluster onshore, where they were more vulnerable to predators.

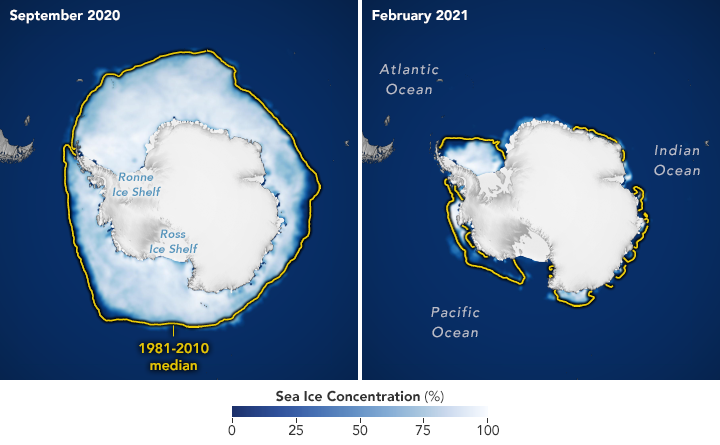
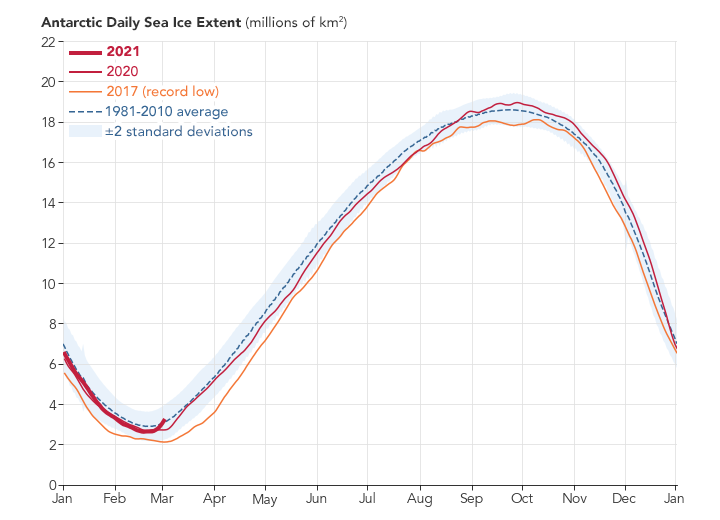
This image pair shows the average Antarctic sea ice extent for September 2020 (left) and February 2021 (right), the months of ice maximum and minimum around the continent. Antarctic sea ice reached its annual maximum on September 28, 2020, when it spanned 18.95 million square kilometers (7.32 million square miles). The 1981–2010 average was 18.6 million square kilometers.
On February 21, 2021, Antarctic sea ice reached its annual minimum at 2.6 million square kilometers (1.0 million square miles), slightly below the 1981–2010 average of 2.8 million square kilometers. Interestingly, the minimum in late February was followed by a period of rapid freezing. More than one million square kilometers of sea ice was added by early March, the fastest expansion on record for that time of year.

Sea ice around Antarctica has been variable lately. Since the start of the satellite record in the late 1970s, seasonal ice cover increased gradually and peaked at a record high in 2014. The next few years showed a rapid decline, wiping out decades of increases. There have been small rebounds in recent years, but nowhere near the record high.
To see these maps in context with the longer-term changes, visit our World of Change series for Arctic sea ice and for Antarctic sea ice.
NASA Earth Observatory images by Joshua Stevens, using data from the National Snow and Ice Data Center. Story by Kathryn Hansen.