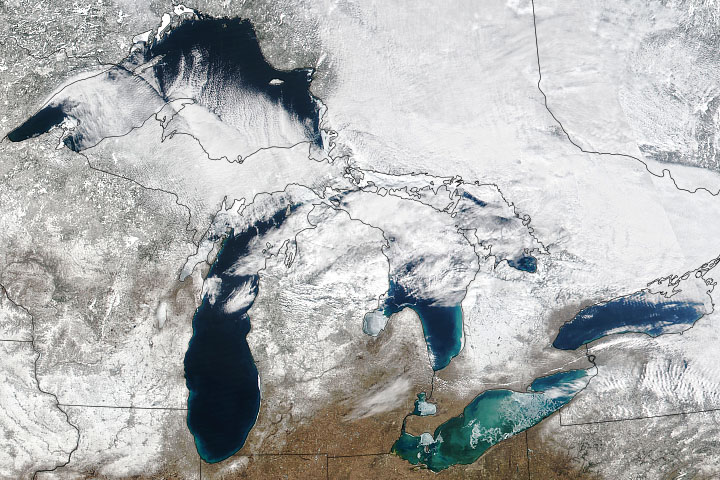
In any given year, the formation, movement, and timing of ice cover on the Great Lakes is temperamental—changing substantially with shifts in weather and climate patterns. The 2020-2021 winter season fit that profile, as wild swings in the weather took Great Lakes ice on a wild ride.
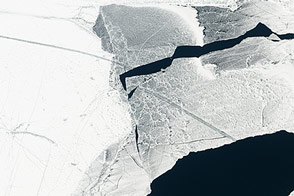
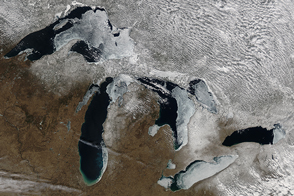
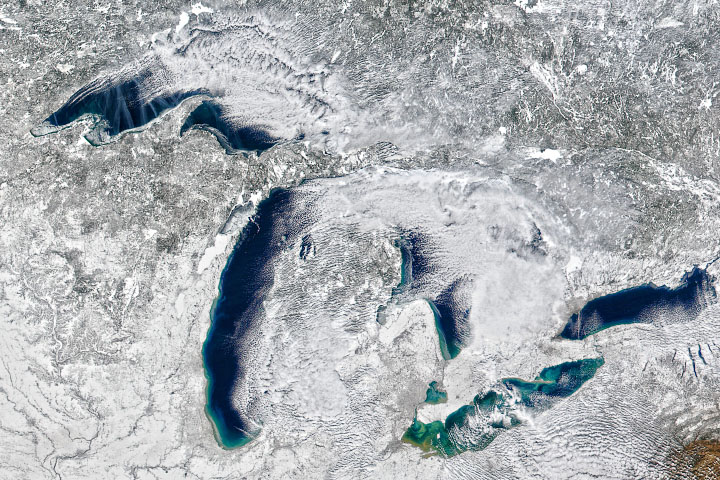
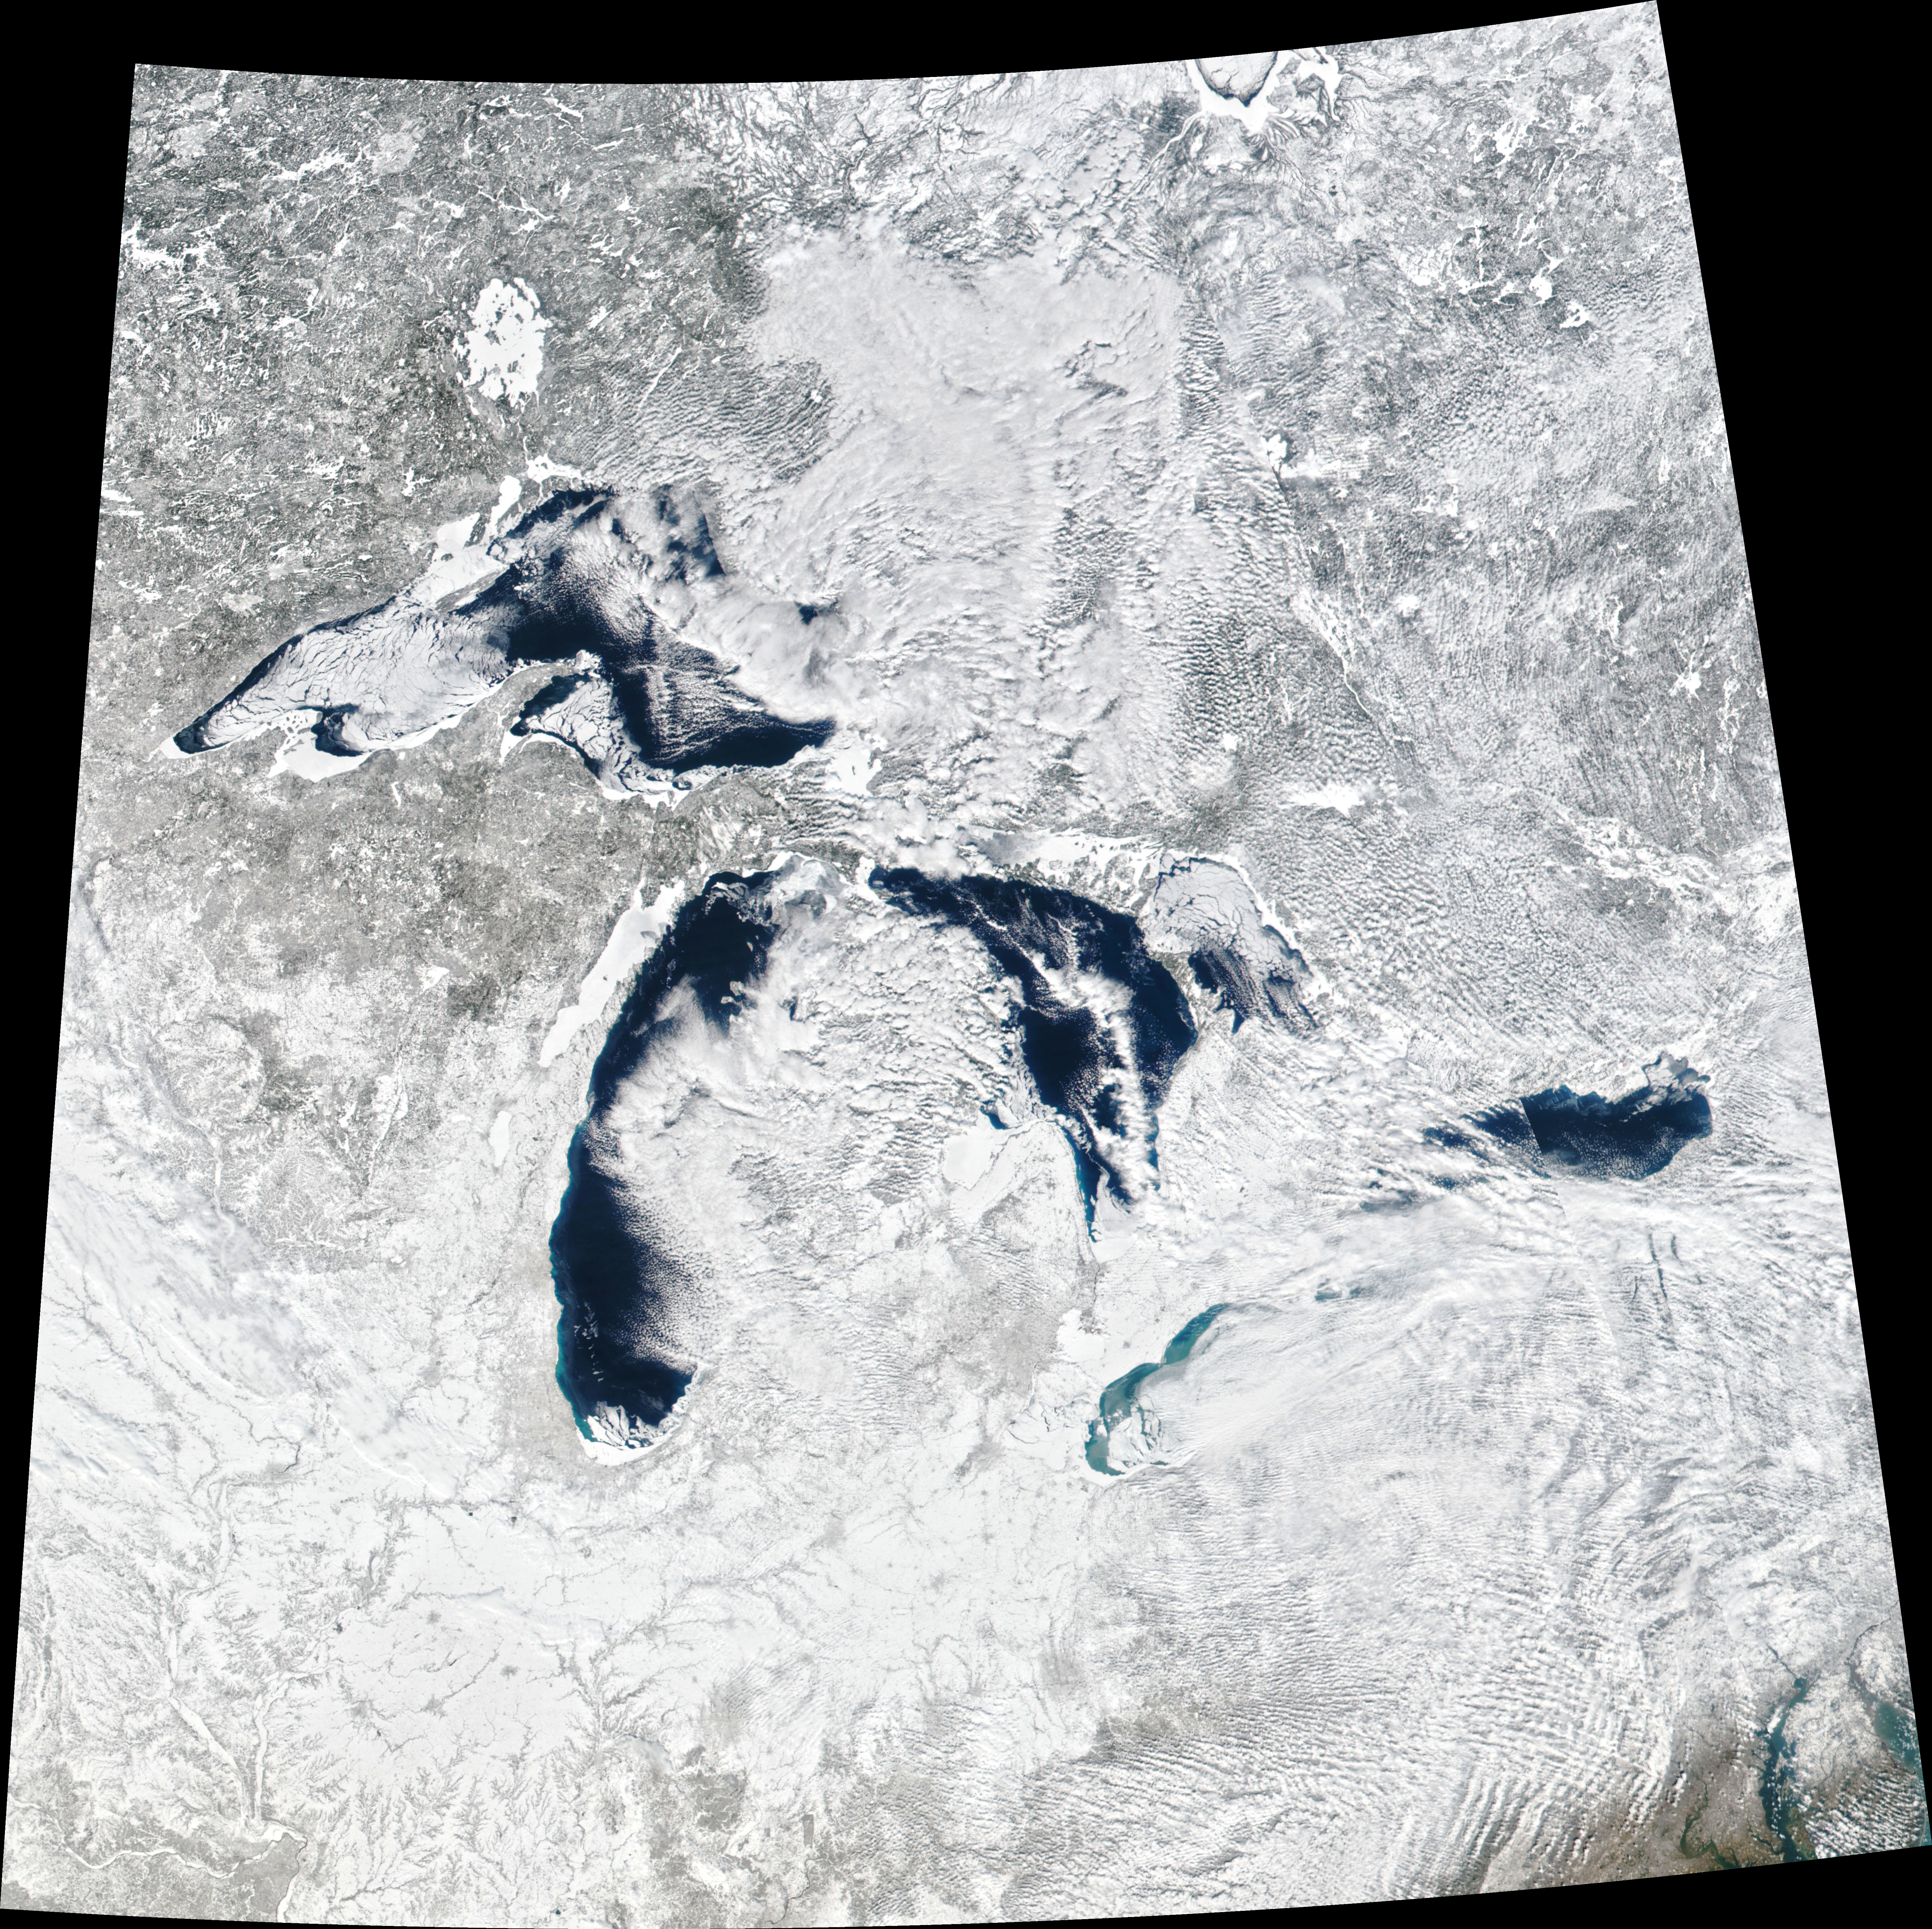
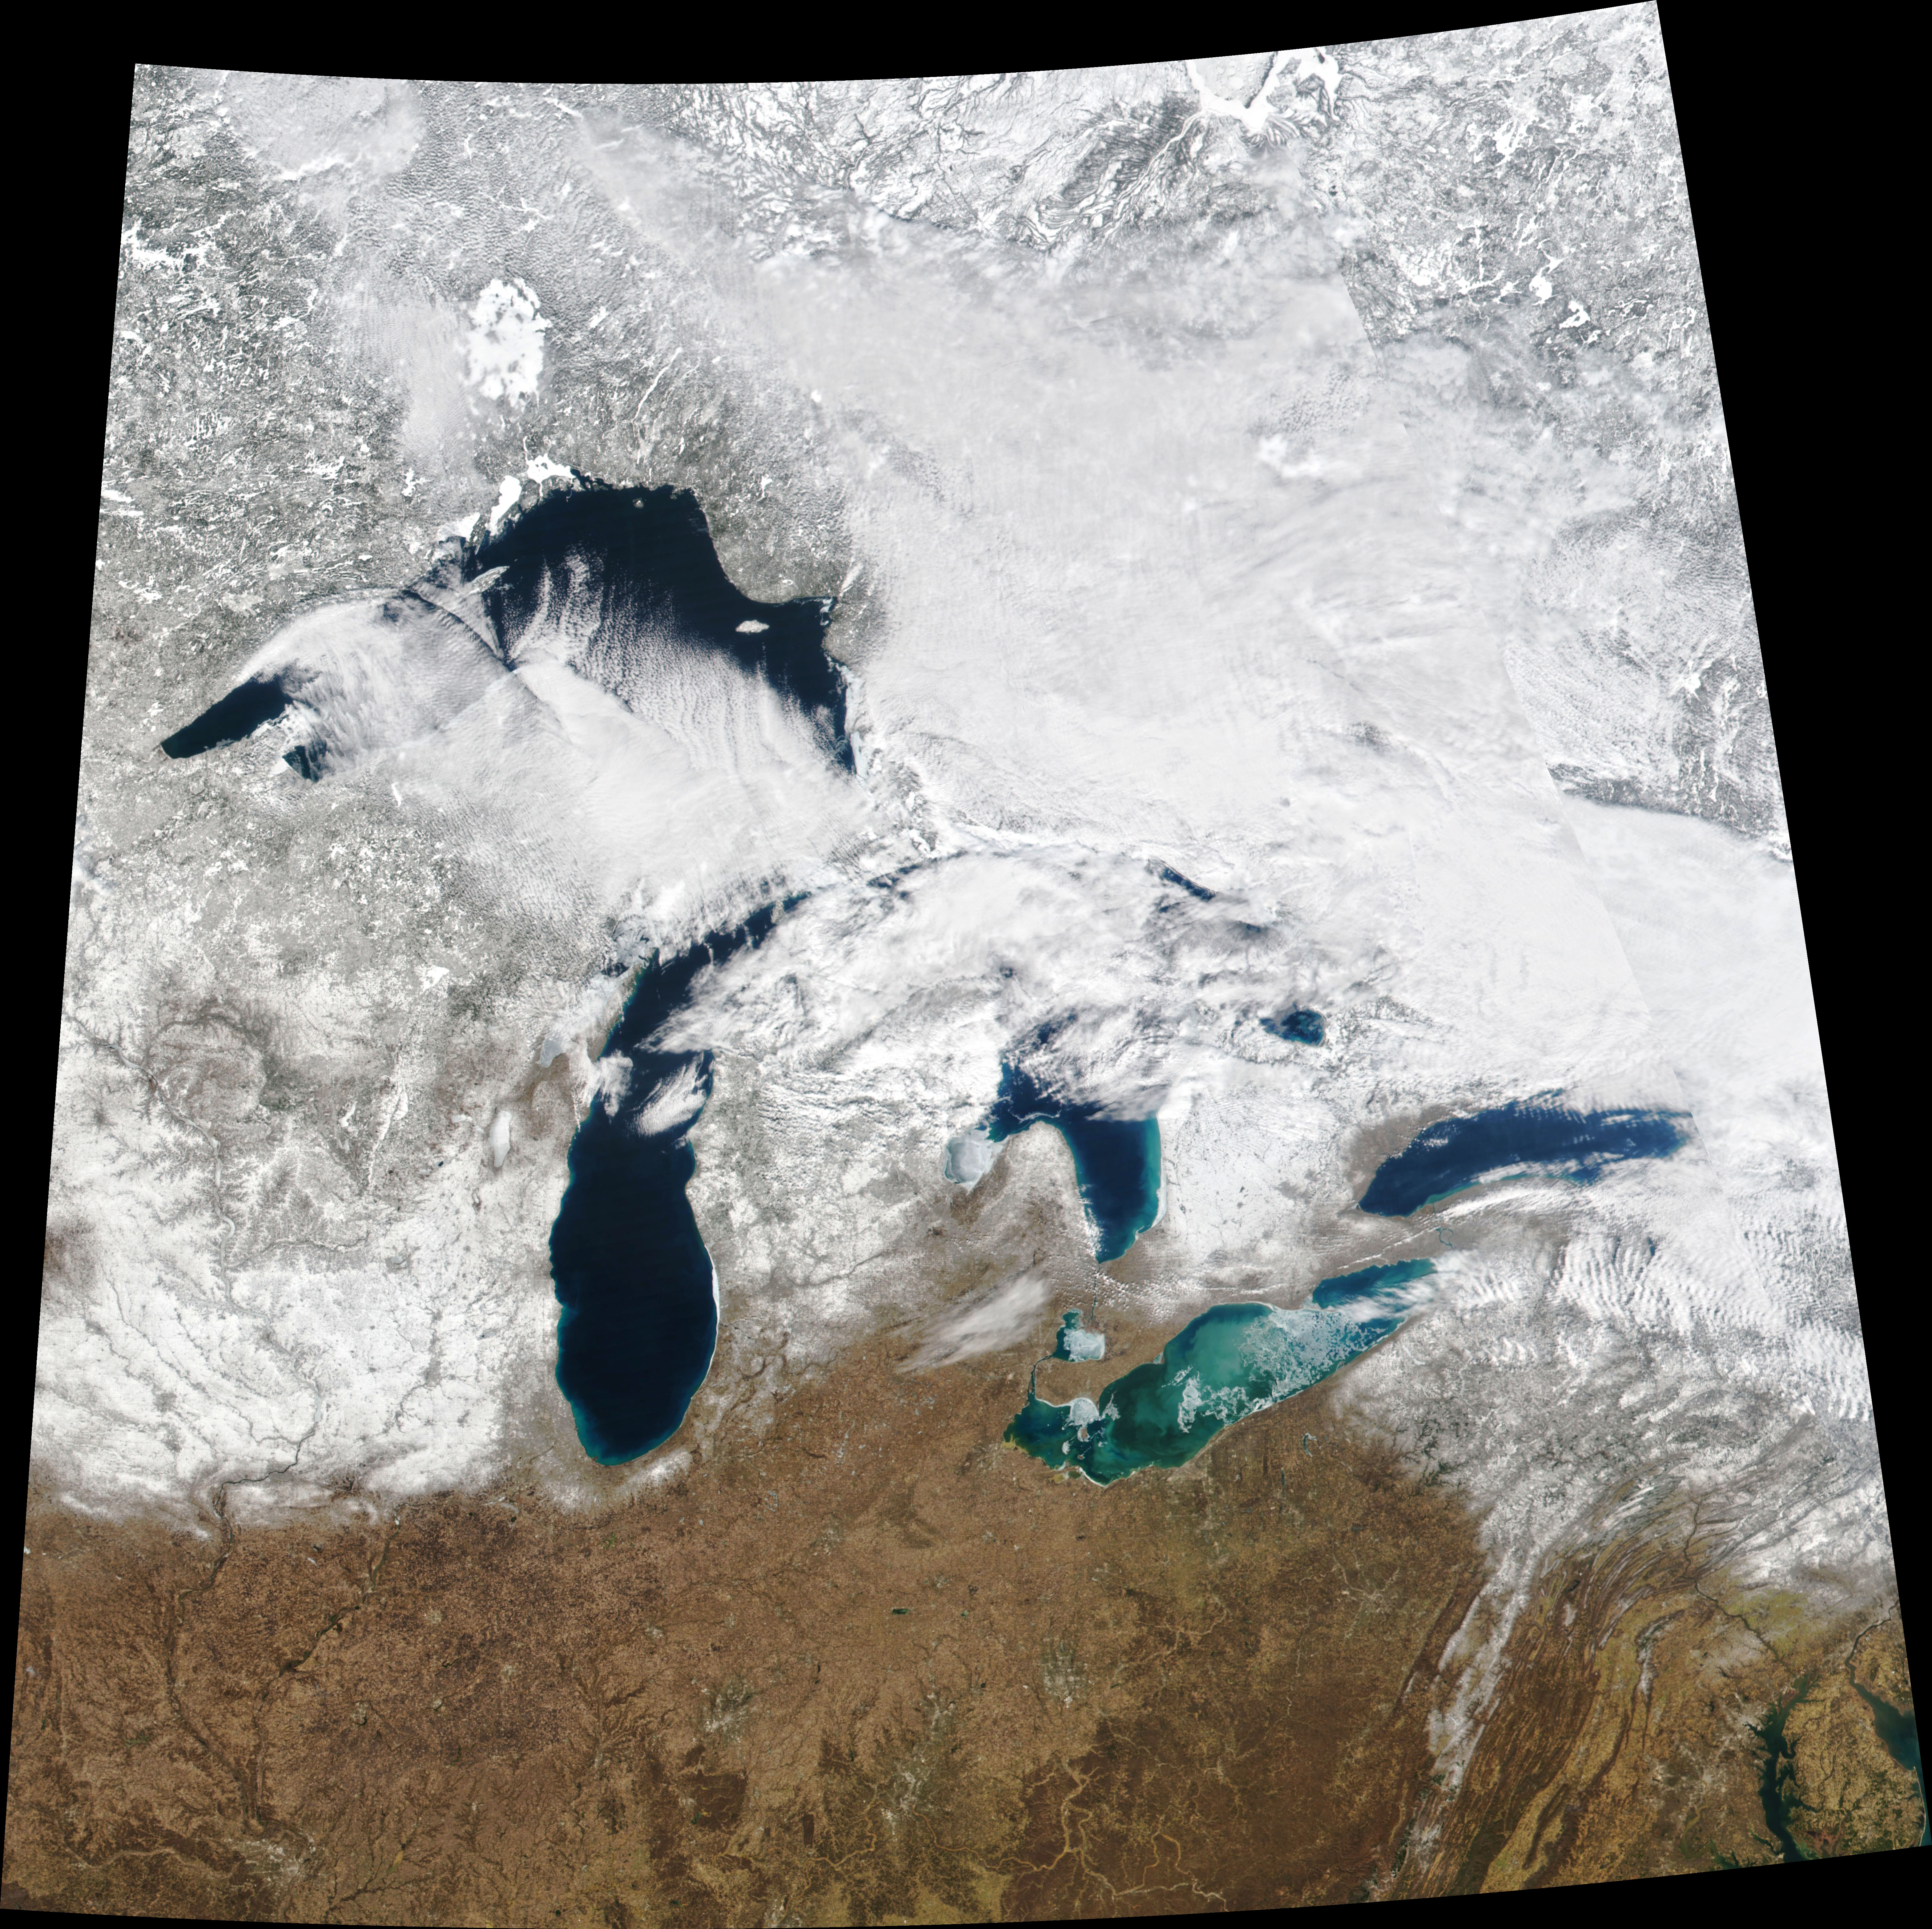
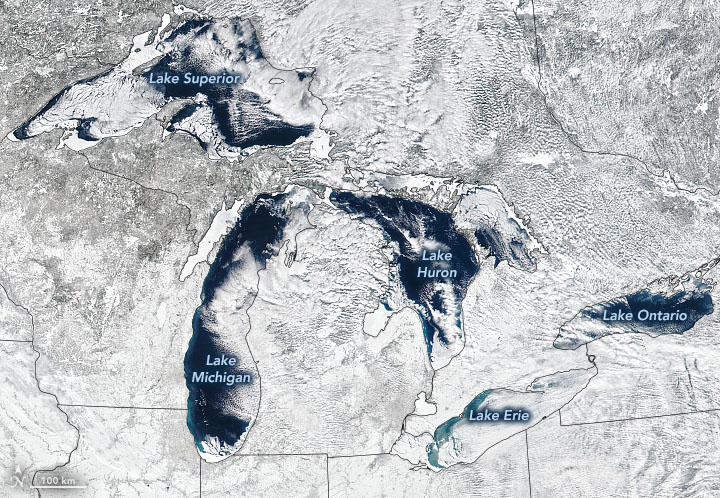
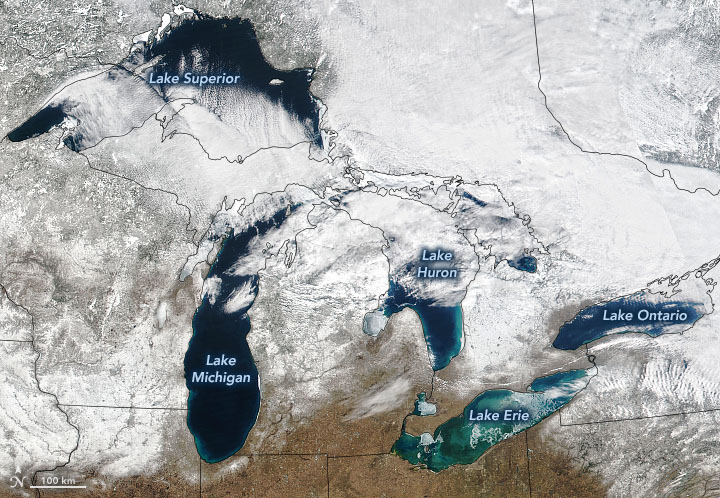
The highs and lows are visible in the natural-color images above, acquired with the Visible Infrared Imaging Radiometer Suite (VIIRS) on the Suomi NPP satellite. On February 20 (left image), total ice cover across the lakes was near the season’s maximum extent of 46.5 percent. By March 3 (right), ice covered just 15 percent of the lake surfaces.
Interestingly, the maximum ice cover this year was near the 1973-2020 average of 53 percent, according to Jia Wang, an ice climatologist at NOAA’s Great Lakes Environmental Research Laboratory.
But that’s where the averageness ends. Much of this ice season—which runs from December 1 through April 30—brought very low levels of ice cover. The exception was early February 2021, when ice made a rapid but short-lived appearance during a visit of frigid Arctic air. “So, I would call it low ice year, despite the February cold snap,” Wang said.
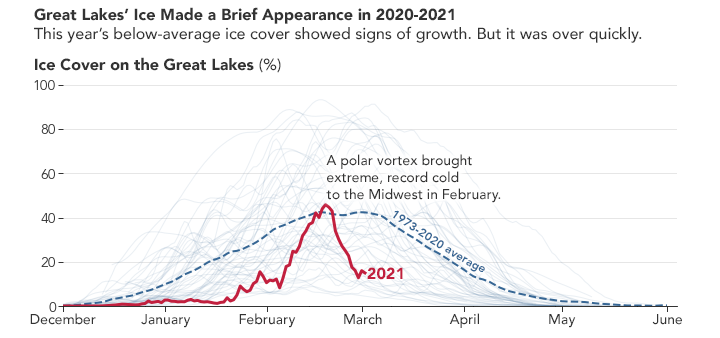
The chart above shows the progression of ice coverage during the 2020-2021 season. According to Wang, air temperatures are the main factor affecting ice cover on the Great Lakes. This season started with unseasonably mild temperatures, as much as 8° Fahrenheit (4.5° Celsius) above normal through mid-January. Lake Erie—the shallowest of the Great Lakes and often the first to freeze—had one of the lowest amounts of ice on record for the time of year.
Early February brought a dramatic shift. Temperatures plummeted as low as 17° F below normal and blue lakes transformed into white lakes. But when temperatures climbed again in mid-February, the fragile ice cover broke up and melted as fast as it had formed. “I expected cold weather would remain for another two weeks until the end of February,” Wang said. “I did not expect it to come and go so fast.”
Ice cover on the Great Lakes can fluctuate dramatically from year to year, controlled by four patterns of climate variability: the North Atlantic Oscillation, the Atlantic Multidecadal Oscillation, the Pacific Decadal Oscillation, and the El Niño-Southern Oscillation. The highest maximum ice cover (94.7 percent) on record occurred in 1979, and the lowest maximum (11.9 percent) occurred in 2002. Low ice cover also prevailed during the 2019-2020 season. The long-term trend in ice cover has generally been downward, declining about 5 percent each decade since the early 1970s.
NASA Earth Observatory images by Joshua Stevens, using VIIRS data from NASA EOSDIS LANCE, GIBS/Worldview, and the Suomi National Polar-orbiting Partnership and lake ice data from NOAA - Great Lakes Environmental Research Laboratory. Story by Kathryn Hansen.