Thanks to the Moon, the Sun, and gravity, the place where the land meets the sea is not a fixed line. What we see on a map is just a representation of where mean sea level is found, and the coast of any landmass is really a moving target between low and high tides. This ever-shifting region is known to scientists as the intertidal zone.
The world’s intertidal zones include an array of ecosystems: sandy beaches, rocky shores, tidal pools, mudflats, seagrass beds, mangrove forests, and fringing coral reefs. So many life forms have adapted to this transitional place, and they play a critical role in the food chain and in nutrient and carbon cycling. For instance, the intertidal zone is an indispensable feeding ground for shorebirds, particularly during migration.
For humans, the zone provides recreational spaces and the first line of defense against the sea. Knowing the width and height of the intertidal zone aids in tsunami preparedness, storm surge risk management, current modeling, and ecological habitat mapping. Yet this region has largely been missed in most mapping efforts, falling between well-mapped dry land and bathymetry (depth) measurements of the ocean.
Harnessing 30 years of Landsat data, researchers from Geoscience Australia recently added this missing piece to their continent, creating the first three-dimensional model of Australia’s pesky, changeable intertidal zone.
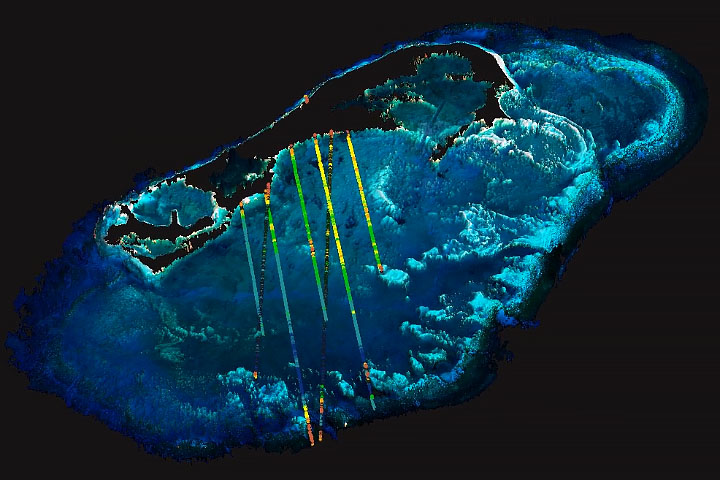
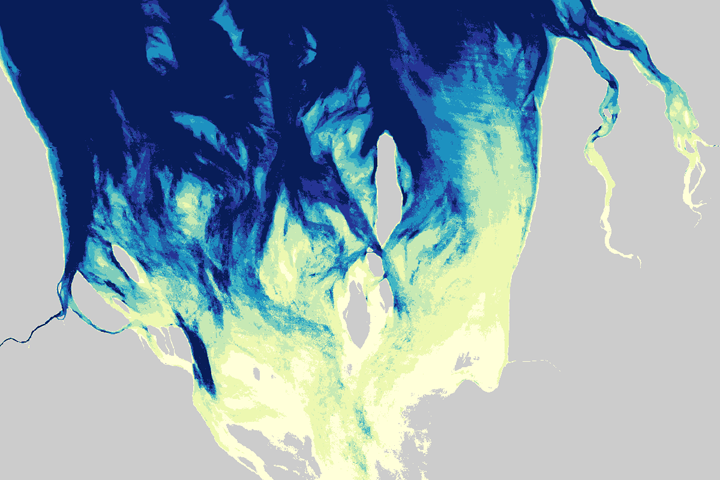
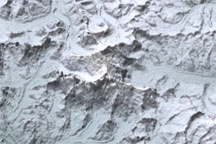
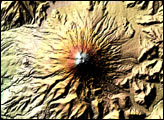
Led by Robbi Bishop-Taylor and Stephen Sagar, the team created the first automated, open-source method for deriving intertidal zone elevations. Then they made the first nationwide coastal elevation model for Australia, the National Intertidal Digital Elevation Model (NIDEM), covering more than 15,000 square kilometers (5,800 square miles) of coast. The work was published in the journal Estuarine, Coast and Shelf Science. Examples of the elevation model are shown on this page, representing the Roebuck (above) and Pilbara (below) coasts.
“The rise and fall of tides can be used to trace the 3D shape of the intertidal zone,” Bishop-Taylor explained. “By sorting 30 years of Landsat satellite images using a tidal model, we can reveal exactly what areas of the coastline are exposed at different levels of the tide.”
Building on earlier work that used Landsat to map the horizontal extent—the x and y directions—of the intertidal zone, the Geoscience Australia team applied knowledge of the tidal range and of the presence or absence of seawater during the tidal cycle to model the elevation—the “z”—relative to mean sea level. The accuracy of this approach for tidal flats and sandy shores is high, approaching that of lidar-derived elevations. For rocky shores and places where the tidal model does not capture the complex or extreme tidal patterns, NIDEM is a bit less accurate.
From coastal risk mitigation to ecological conservation, NIDEM stands ready to help coastal managers. For instance, researchers at James Cook University have already incorporated the full NIDEM data set into the elevation model for the Great Barrier Reef and Queensland coast. The Queensland Government used an earlier version of this elevation model for regional habitat mapping. And Sagar noted that his team has introduced NIDEM to the hydrographic surveying community as a cost-effective means to fill the gap between ship-based bathymetry measurements and terrestrial elevation data.
Images by Robbi Bishop-Taylor/Geoscience Australia, using Landsat data from the U.S. Geological Survey and the National Intertidal Digital Elevation Model (NIDEM). Story by Laura Rocchio, NASA Landsat Science Outreach Team, with Mike Carlowicz.