
The key to stopping or slowing global warming may lie with cities—particularly large and wealthy ones. That was the major finding of an effort to map the carbon footprint of 13,000 cities—one of the first times researchers analyzed so many areas with a consistent methodology.
“A small number of large and or affluent cities drive a significant share of national total emissions,” said Daniel Moran, an environmental economist at the Norwegian University of Science and Technology. “This means concerted action by a small number of local mayors and governments has the potential to significantly reduce national total carbon footprints.”
Seoul, Guangzhou, New York, Hong Kong, and Los Angeles had the largest carbon footprints in the world, according to the research team. The complete list is available here.
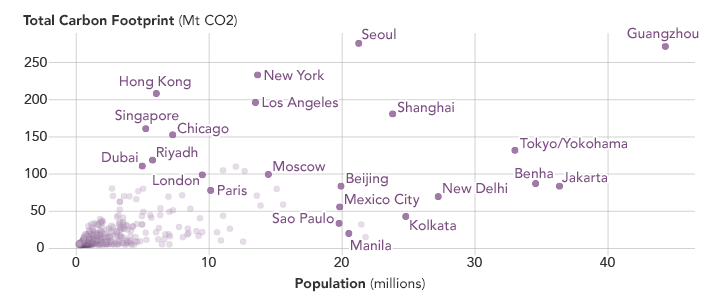
The maps on this page depict the carbon dioxide footprints for cities in Asia and North America—two of the highest emitting regions in the world. As shown by the chart below, emissions generally tracked closely with a city’s population, though there were exceptions. The urban agglomerations of Cairo, Jakarta, and Tokyo all had populations that exceeded 30 million people, for instance, but these cities had comparatively low carbon footprints (below 150 million tons). On the other hand, Hong Kong, Singapore, Chicago, New York, and Los Angeles had emissions that exceeded 150 million tons even though the cities had fewer than 20 million people.

The 100 highest-emitting urban areas accounted for 18 percent of the global carbon footprint, the researchers found. In most countries, both rich and poor, the top three largest urban areas drove more than one-quarter of national emissions. The cities with the largest per per person footprint tended to be exceptionally wealthy. Topping that list were Hong Kong, Abu Dhabi, Dubai, Singapore, and Hulun Buir.
The researchers looked closely at the income of residents, the city’s population, and the density of development. More than anything else, wealth correlates with a higher carbon footprint because wealthier people generally consume more goods, live and work in larger buildings, travel more widely, and eat more meat. In the United States, suburban parts of cities have especially large footprints. Other factors that affect a city’s carbon footprint include the availability of renewable energy for heating and cooling, the quality of buildings, dietary patterns of residents, and transportation options.
The model the researchers developed to produce this ranking made use of preexisting carbon footprint estimates for 31,000 zip codes in the United States, plus similar estimates for the European Union, the United Kingdom, China, and Japan. It also included national statistics on the composition of urban versus rural spending patterns, regional purchasing power data, and a population map.
Comparing the carbon footprints for all of the world’s cities in a consistent way was not a simple task. Even defining the extent of a city proved complicated, explained Moran. Cities have political boundaries, of course, but in many cases population density does not match up cleanly with the official lines of a city. The Maryland and Virginia suburbs of Washington, D.C., for instance, could reasonably be considered separate cities or counted as part of the District. Meanwhile, some of the world’s largest urban areas, like the Pearl River Delta, are technically conglomerations of several cities.
Satellite data can serve as a powerful tool for studying cities in a consistent way, noted study co-author Karen Seto, a Yale geographer who regularly works with remote sensing data to study urbanization. In this case, the research team opted to use a satellite-based dataset developed by the European Commission called the Global Human Settlement Layer–SMOD. The data is derived from Landsat observations of built-up areas and buildings, but it has been merged with census information and a model that distinguishes urban and rural areas. By this definition, cities are contiguous, high-density areas with more than 1,500 inhabitants per square kilometer. In practice, this means suburbs often get lumped together with central cities.
“The Global Human Settlement Layer (GHSL) data were instrumental for this analysis,” explained Seto. The GHSL makes use of Landsat data that goes back to the Multispectral Scanner (MSS), a sensor that collected data between the 1970s and 1990s as part of multiple Landsat missions. “Even as new sensors and data become available, Landsat remains the workhorse for Earth science because of its long archive. Landsat is what makes products like the GHSL possible.”
NASA Earth Observatory images by Joshua Stevens, using data from Moran, D., et al. (2018). Story by Adam Voiland.