The Earth Observatory has published its last Image of the Day on this website. Please join us on our new home at science.nasa.gov/earth/earth-observatory.
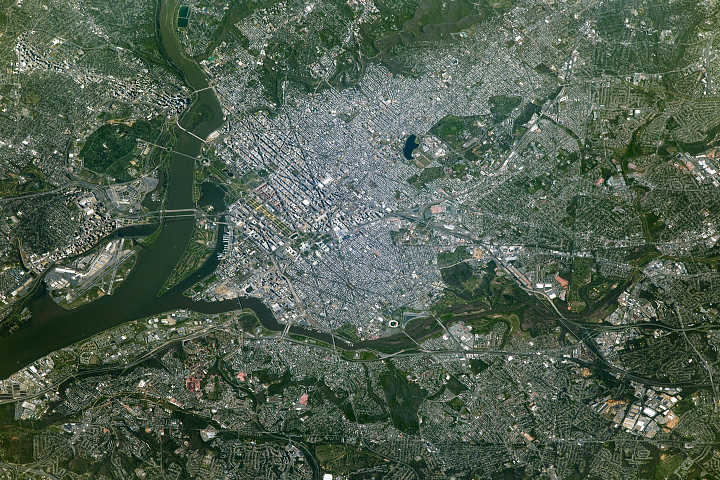
When the Capital Beltway (I-495) first opened in 1964, the circular highway had four to six lanes of traffic—two or three lanes each way. By 2010, virtually all of the Beltway had at least eight lanes, with ten to twelve in some areas.
Nevertheless, the 104 kilometer (64 mile) highway remains infamous for traffic gridlock. Several decades of flight from the District of Columbia’s core, combined with rapid population growth in suburban Virginia and Maryland, mean the highway can easily turn into a parking lot during rush hour.
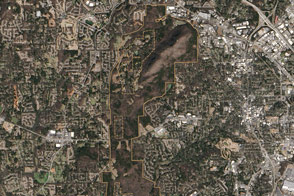
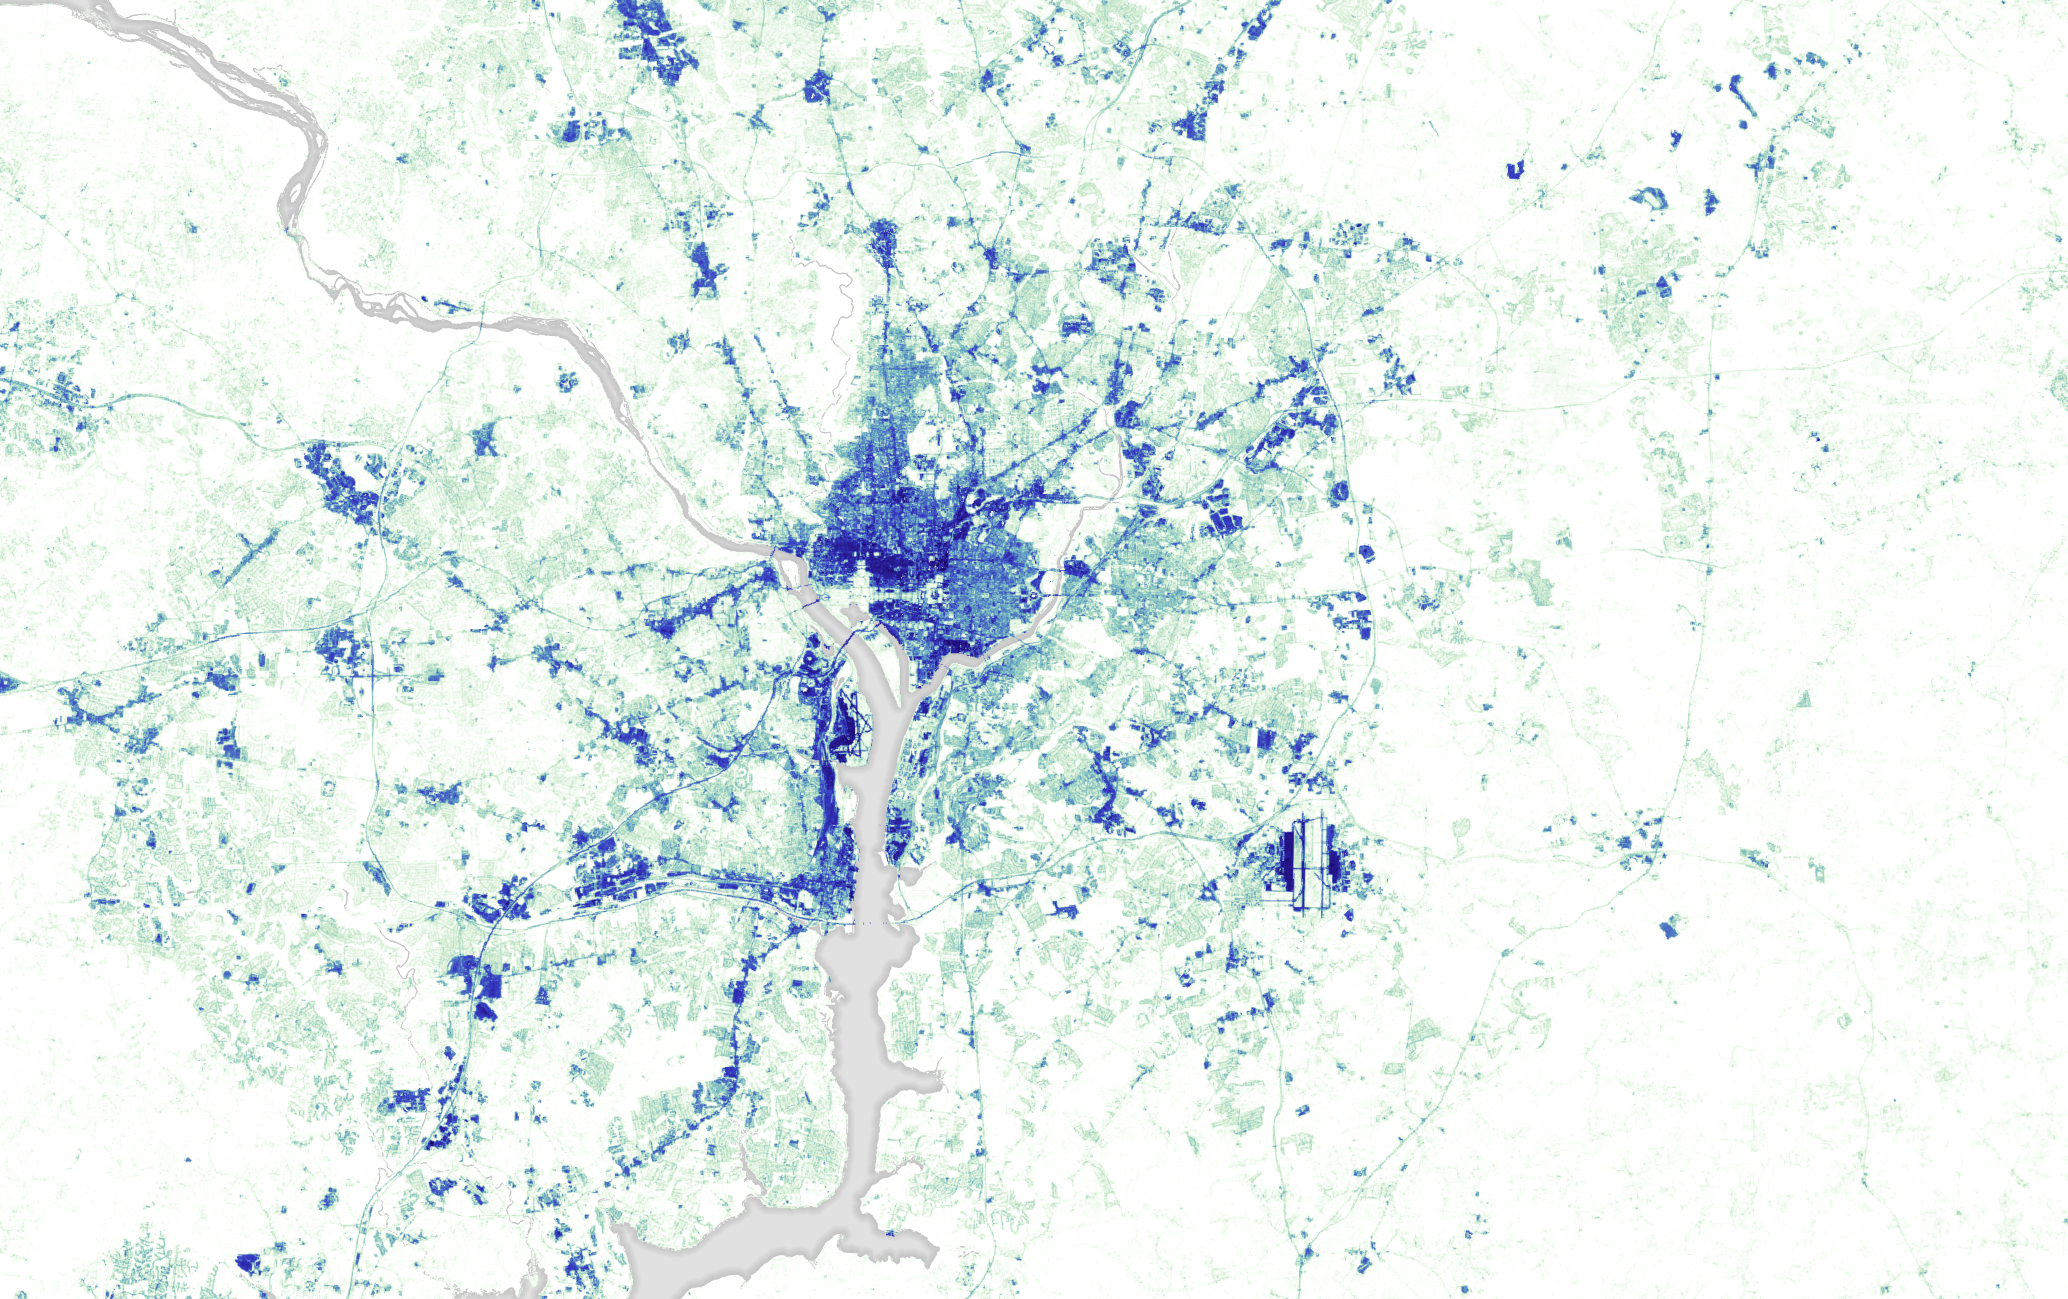
The Beltway is just one of many parts of the Washington metropolitan area where pavement has replaced greener landscapes. A team of University of Maryland scientists recently published satellite-based maps of impervious surfaces that show how much urbanization has changed the character of the region. Any surface that water cannot pass through—for instance, rooftops, roads, parking lots, and sidewalks—is considered impervious.
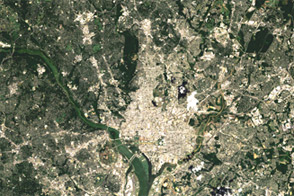
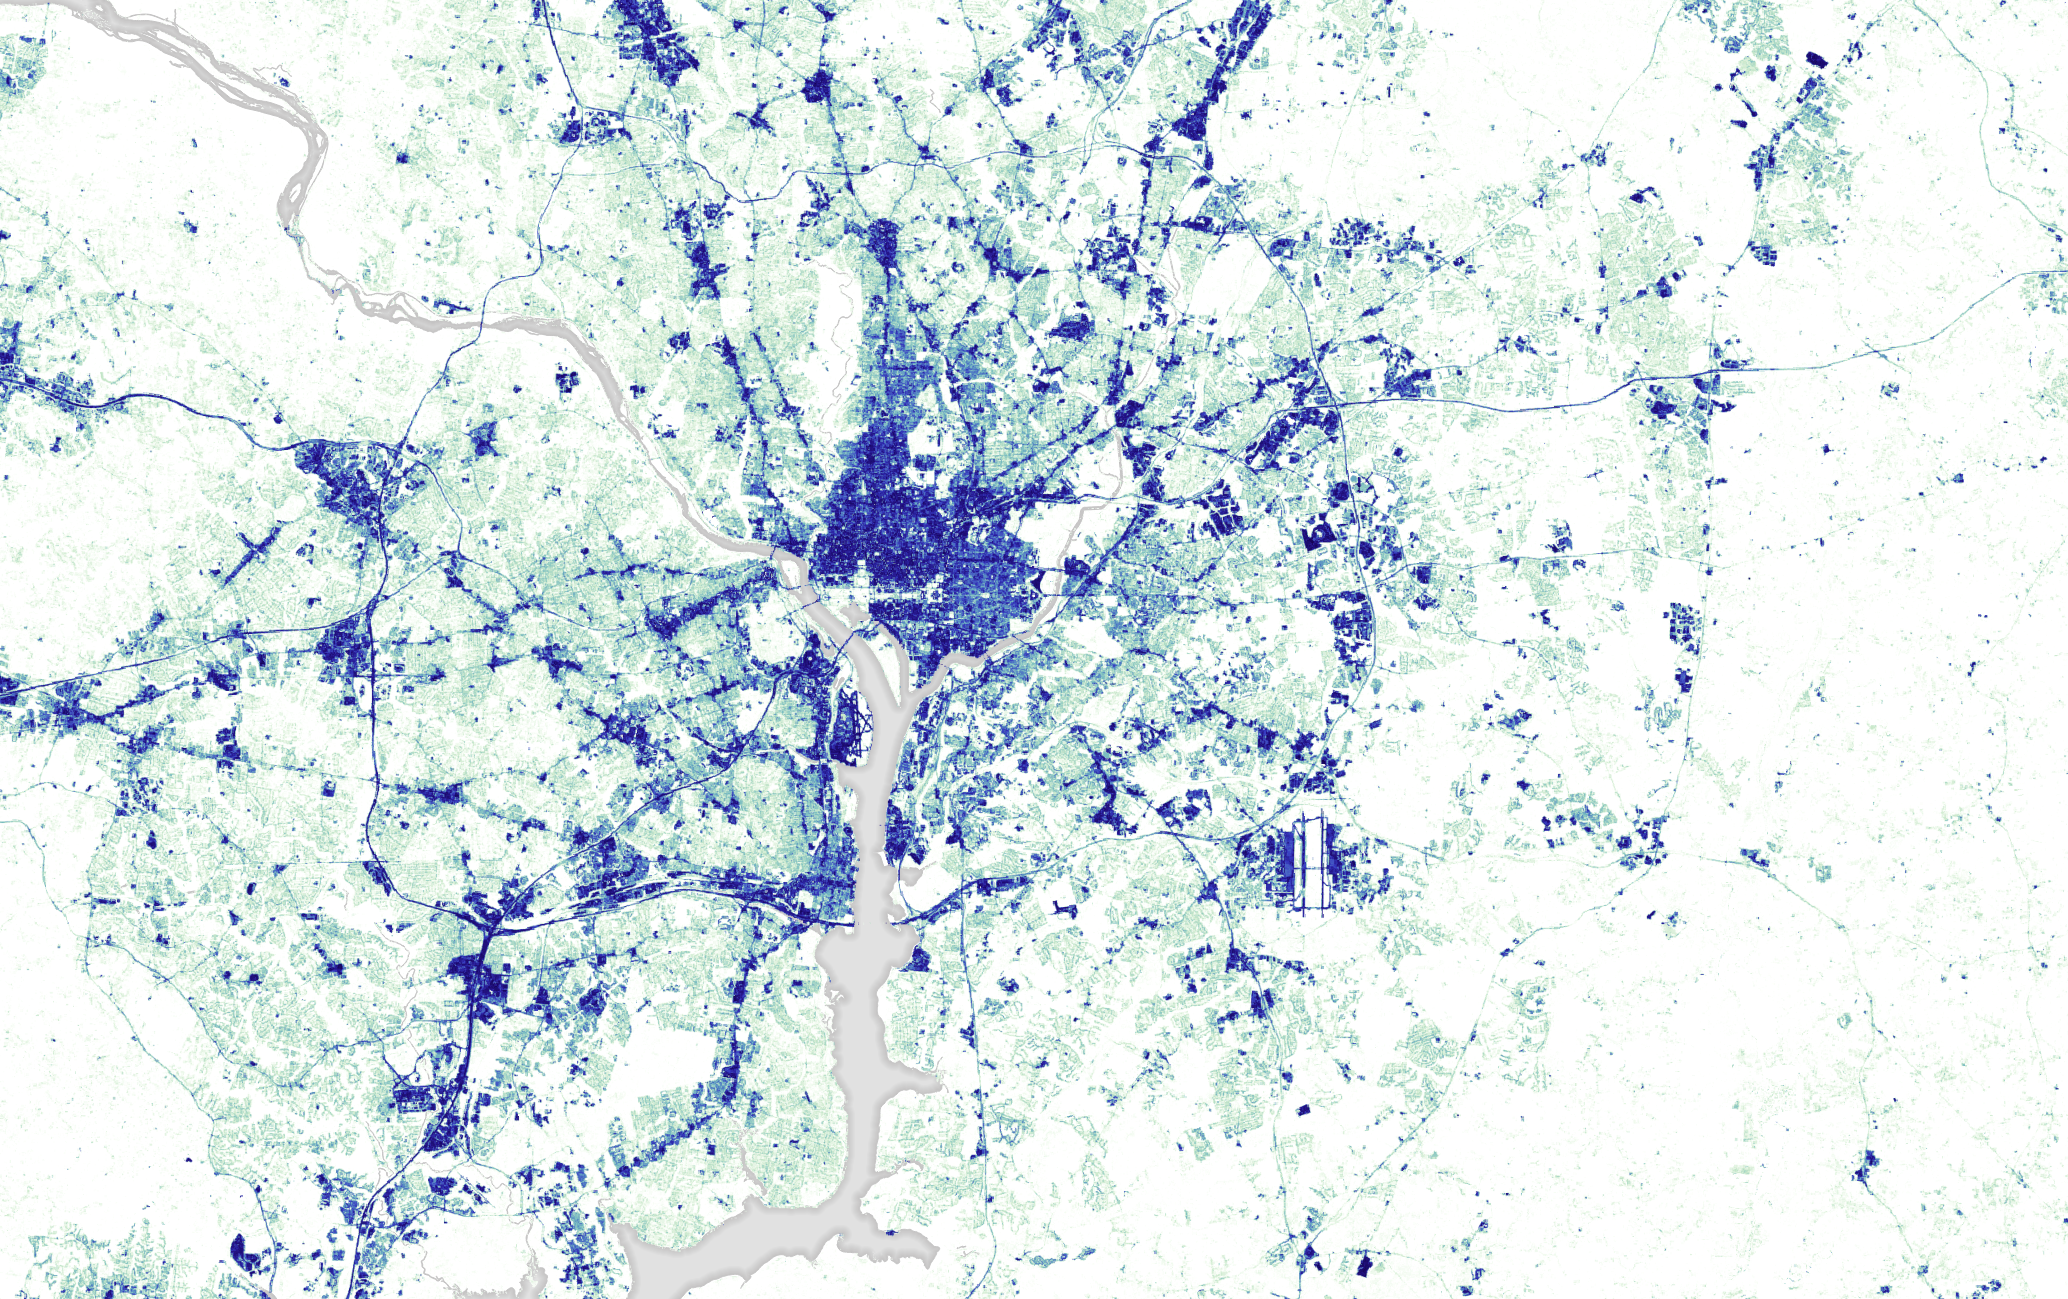
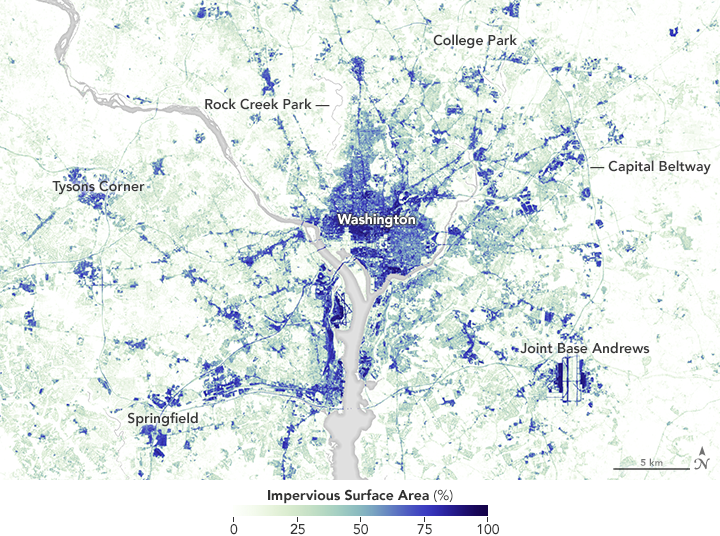
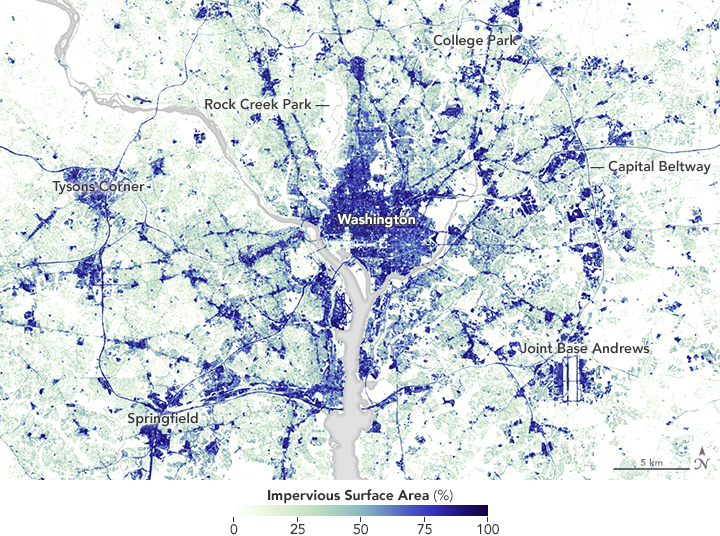
The maps above show the extent of impervious surfaces in 1984 (top) and 2010. Areas with the greatest concentration of impervious surfaces are depicted with dark blue; areas with the lowest concentration of impervious surface areas are white. In addition to the widening of the Beltway, notice how pavement has proliferated in Fairfax and Loudoun counties in Virginia and Prince George’s and Montgomery counties in Maryland. The District of Columbia was already densely developed in 1984, so the changes there are less noticeable.
The spread of impervious surfaces was widespread across the region, but development was particularly intense along key lines of transportation. Much of the development occurred along the Beltway in communities such as Tysons Corner, Springfield, College Park, and New Carrollton. Inside the Beltway, building followed the Metro rail lines.
“The percentage of impervious cover inside the Beltway went from 22 percent in 1984 to 26 percent in 2010,” explained Xiao-Peng Song, the University of Maryland scientist who led the team that conducted the research. “The pace of development—9 to 11 square kilometers per year—was striking. If we assume, conservatively, that the depth of impervious cover is about one-tenth of a meter, then that equals one million cubic meters of pavement, buildings, and the like every year for nearly three decades,” added Joseph Sexton, one of the University of Maryland scientists who conducted the research.
Also striking, Song said, is that the pace of development increased over the period of the study. “The annual rate of expansion has doubled since the 1980s, from 6 to 12 square kilometers,” said Song. “One might assume that a region such as the DC metropolitan area is ‘built out’, but this is not true.”
This latest study builds upon earlier research published in 2013. The researchers hope the two studies make it clear that satellite programs such as Landsat can be used to reliably map the history of urban development. As planners grapple with significant environmental issues related to stormwater runoff and climate change in the future, the University of Maryland researchers think a satellite-based perspective will prove increasingly critical.
NASA Earth Observatory images by Joshua Stevens, based on Landsat data from Song et al. (2015). Caption by Adam Voiland.