Carbon dioxide emissions from fossil fuels rose again in 2023, reaching record levels, according to estimates from an international team of scientists. The continued rise in emissions from the burning of oil, coal, and natural gas is impeding progress to limit global warming, the scientists said.
The finding is part of an annual checkup on Earth’s carbon cycle called the Global Carbon Budget. In this annual assessment, scientists quantify how much carbon was added to the atmosphere from burning fossil fuels and land-use change, and how much carbon was removed from the atmosphere and stored on land and in the ocean.
Scientists’ early analysis of 2023 data shows that emissions from fossil fuels rose 1.1 percent in 2023 compared to 2022 levels, bringing total fossil emissions in 2023 to 36.8 billion metric tons of carbon dioxide. When including other sources—such as deforestation and the extreme wildfire season in Canada—total emissions in 2023 were estimated to be 40.9 billion metric tons. Both 2023 and 2022 saw record increases in carbon dioxide from fossil fuels, according to the analysis.
“Emissions are heading the wrong direction that we need to limit global warming,” said Ben Poulter, a co-author of the report and scientist at NASA’s Goddard Space Flight Center. The concentration of carbon dioxide in the atmosphere has increased from approximately 278 parts per million in 1750, the beginning of the industrial era, to 420 parts per million in 2023.
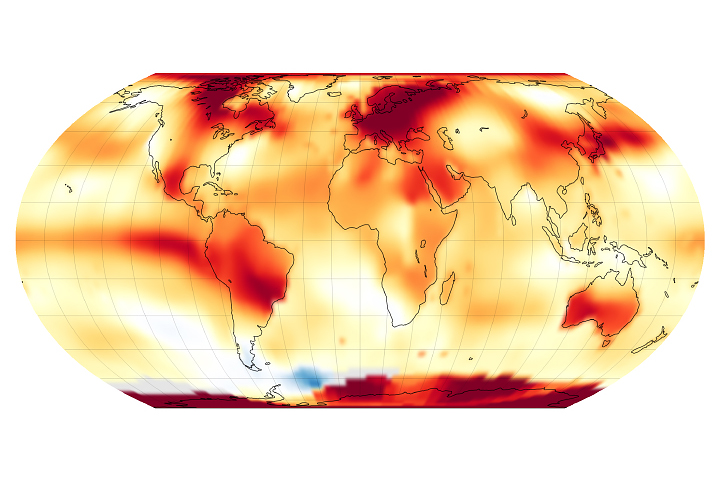
The rise in heat-trapping carbon dioxide—and other greenhouse gases—is the primary reason for the planet’s soaring temperatures. The global surface temperature in 2023 was 1.2 degrees Celsius (2.1 degrees Fahrenheit) warmer than the average for NASA’s baseline period (1951-1980), making it the hottest year on record.
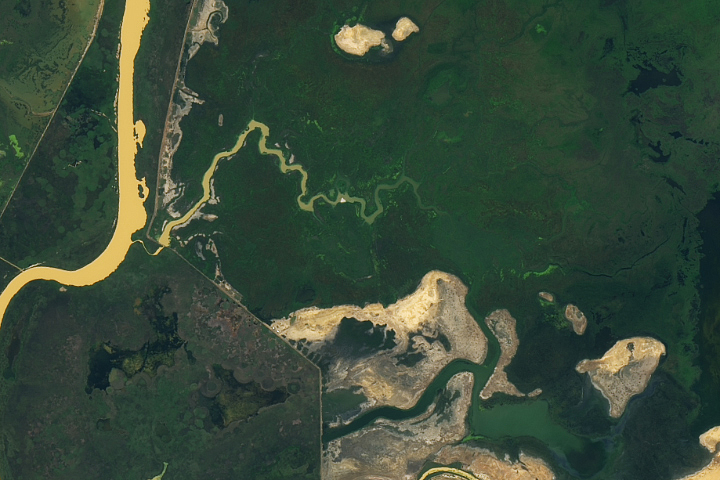
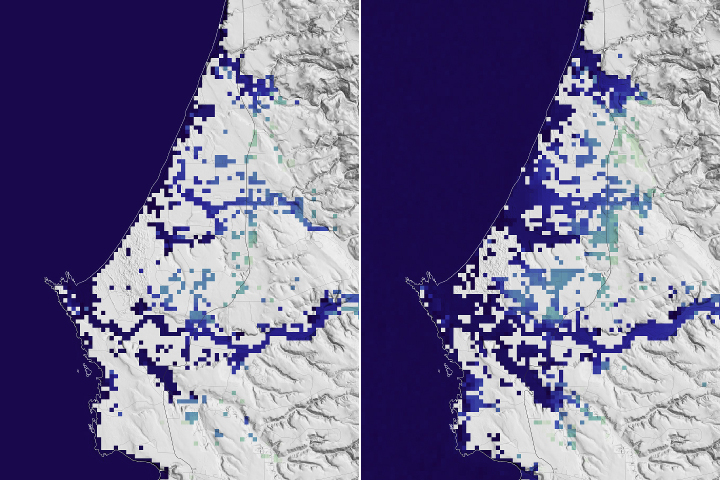
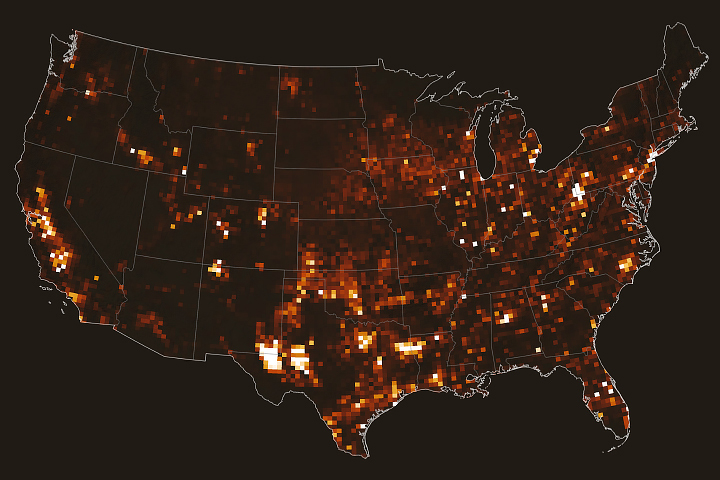
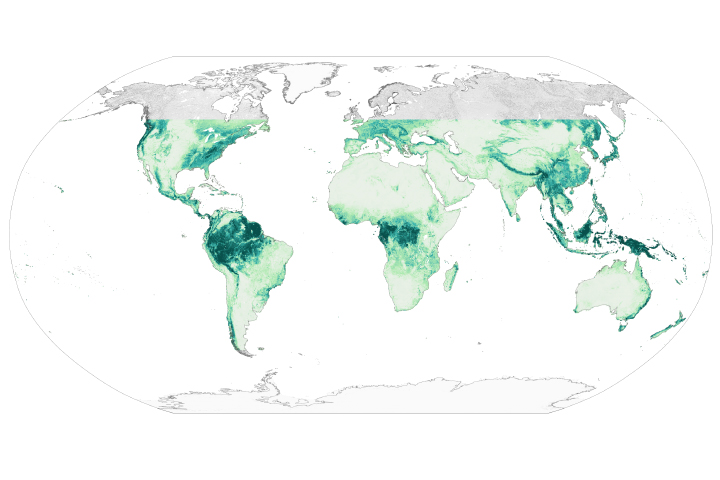
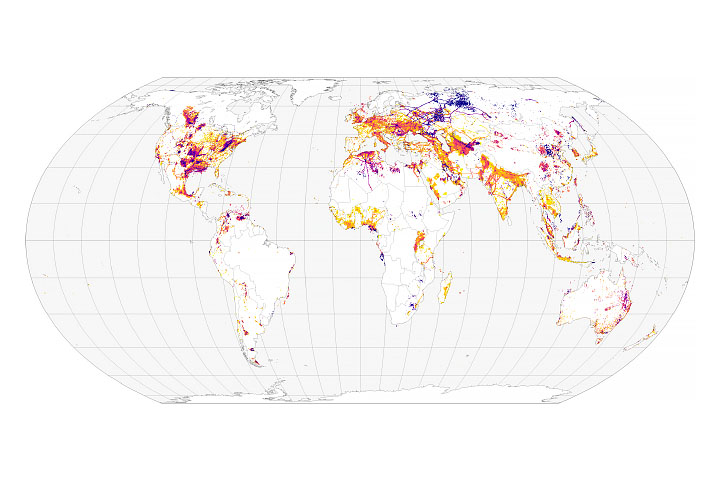
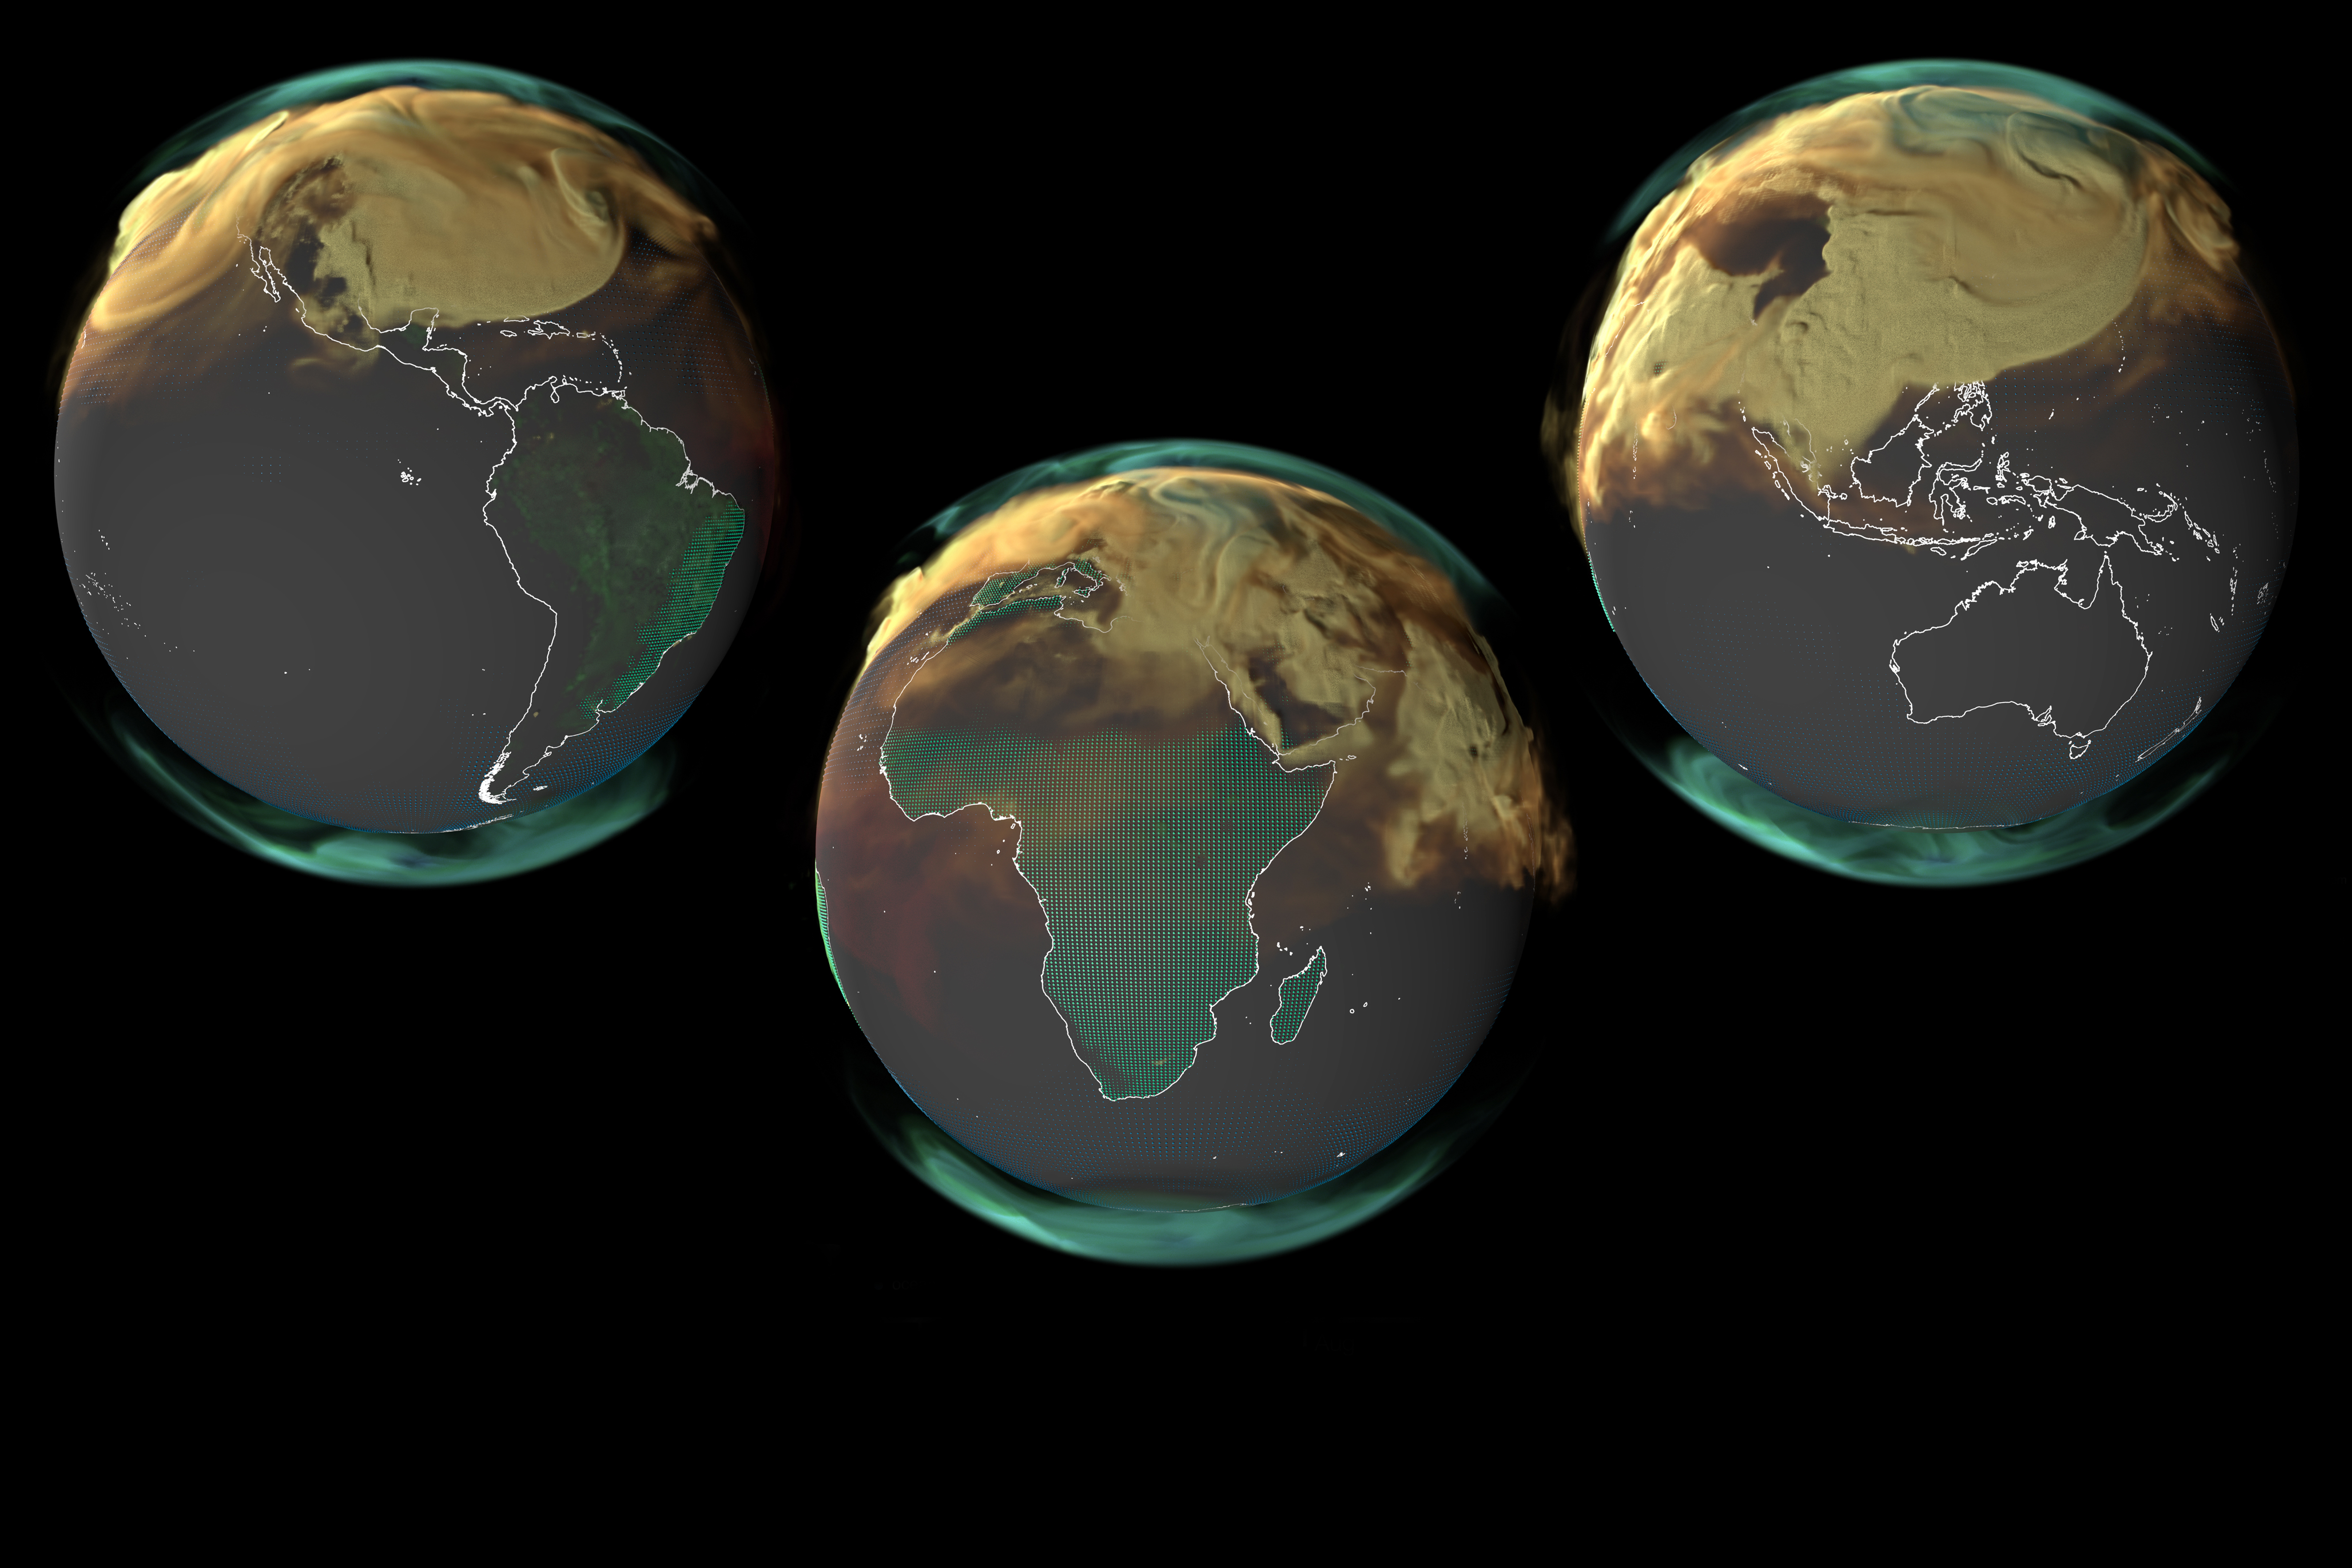
The visualizations above shows the flow of carbon dioxide into, around, and out of Earth’s atmosphere over the course of 2021 (the most recent full year of available data). They rely on NASA’s Goddard Earth Observing System (GEOS), a modeling and data assimilation system used for studying the Earth’s weather and climate. To depict where carbon is being emitted or taken up, researchers used data on vegetation, human population density, and the location of wildfires, power plants, roads, railways, and other infrastructure.
The carbon dioxide shown in the visualizations comes from four major sources: fossil fuels (yellow), burning biomass (red), land ecosystems (green), and the ocean (blue). Though the land and ocean are both carbon sinks—which means they store more carbon than they emit by removing carbon dioxide from the atmosphere—they can be sources at certain times and places. The green and blue dots represent carbon that was absorbed by the land and ocean.
“Amazingly, the ocean and land continue to absorb about half of the carbon we emit,” Poulter said. “Only about 44 percent of emissions stay in the atmosphere each year, slowing the rate of climate change, but causing ocean acidification and altering how land ecosystems function.”
The proportion of carbon dioxide that stays in the atmosphere, known as the airborne fraction, has remained remarkably stable over the past 60 years, even with the continued increase in human-caused emissions. But scientists question whether and for how long that stability will continue.
A NOAA-led study published in 2023 analyzed carbon storage in the ocean over two decades and found evidence that this carbon sink may be losing some of its storage capacity. They speculate that the ocean has slowed its absorption because it has already accumulated substantial amounts of carbon dioxide. And changes in global ocean circulation may be decreasing the amount of carbon that is transferred from surface waters to the ocean floor, where it can be stored for hundreds of years.
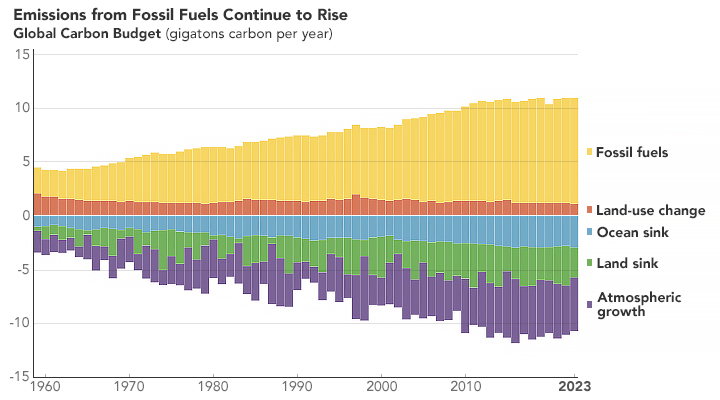
The chart above shows the combined components of the global carbon cycle from 1960 to 2023. It shows how much carbon is being emitted from fossil fuels (yellow) and land use change (orange), and how much is taken up by the atmosphere (purple), ocean (blue), or land (green).
The Global Carbon Budget relied on several data sources to develop a complete picture of Earth’s carbon cycle. The primary sources were inventories of emissions collected by governments and energy agencies. Satellite data from NASA’s OCO-2 (Orbiting Carbon Observatory-2) instrument was also used to estimate the flux of carbon between the land and atmosphere.
According to the report, carbon dioxide emissions are falling a bit in some regions, including Europe and the United States, but still rising globally. The countries with the largest increase in emissions in 2023 were India and China.
In December 2015, delegates from 196 countries negotiated the Paris Agreement, which called for holding the global average temperature to “well below 2 degrees Celsius above pre-industrial levels,” while “pursuing efforts to limit the temperature increase to 1.5°C.” The Global Carbon Budget team also analyzed the remaining carbon budget before emissions could push the planet past 1.5 degrees. They estimate at the current emissions level, “there is a 50 percent chance global warming will exceed 1.5°C consistently in about seven years.”
NASA and other U.S. federal agencies regularly collect data on greenhouse gas concentrations and emissions, such as those in the visualizations above. These data are now available at the recently launched U.S. Greenhouse Gas Center, a multi-agency effort that consolidates information from observations and models, with a goal of providing decision-makers with one location for data and analysis.
NASA Earth Observatory chart by Michala Garrison, using data from Friedlingstein, Pierre, et al. (2023). Image and video by Andrew J. Christensen, Anansa Keaton-Ashanti, and Mark SubbaRao, courtesy of NASA’s Scientific Visualization Studio and adapted for NASA Earth Observatory, using data from NASA’s Global Modeling and Assimilation Office. Story by Emily Cassidy.