Methane is a climate “super pollutant,” causing 30 times more warming per ton than carbon dioxide. The short-lived but potent greenhouse gas is currently responsible for approximately one third of global warming from all greenhouse gases. Because of methane’s potency, the United States signed the Global Methane Pledge which aims to reduce collective global emissions by 30 percent from 2020 levels by 2030.
The first step in reducing emissions is knowing how much is released to the atmosphere. In a new satellite-based analysis, scientists calculated that methane emissions from the contiguous U.S. were higher in 2019 than previously estimated.
The U.S. Environmental Protection Agency (EPA) assesses human-caused methane emissions by taking inventory of known emissions sources, such as landfills, livestock operations, and oil and gas facilities. These emissions are then reported to the United Nations Framework Convention on Climate Change. Satellite observations and atmospheric models provide a way to identify where some of this accounting is potentially too high or low.
An international team of scientists combined observations from the TROPOMI (Tropospheric Monitoring Instrument) aboard the Sentinel-5 Precursor satellite with the GEOS-Chem atmospheric transport model to generate a high-resolution map of total U.S. methane emissions in 2019.
“This approach allowed us to trace the path of emissions from the atmosphere back to the sources on the ground,” said Hannah Nesser, a postdoctoral fellow at NASA’s Jet Propulsion Laboratory (JPL) who led the research.
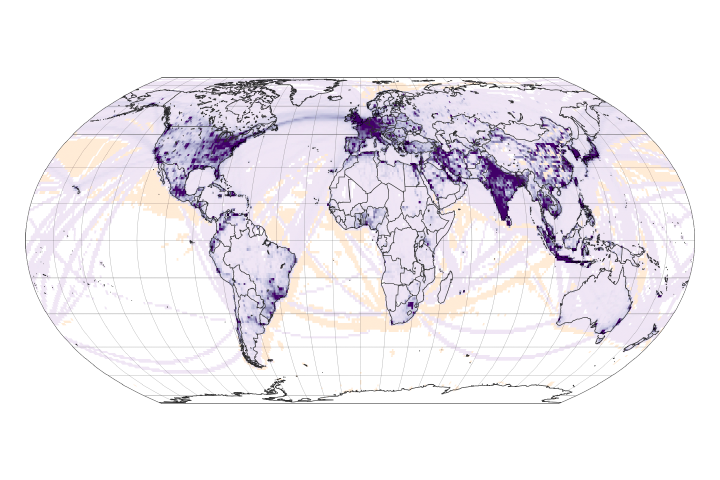
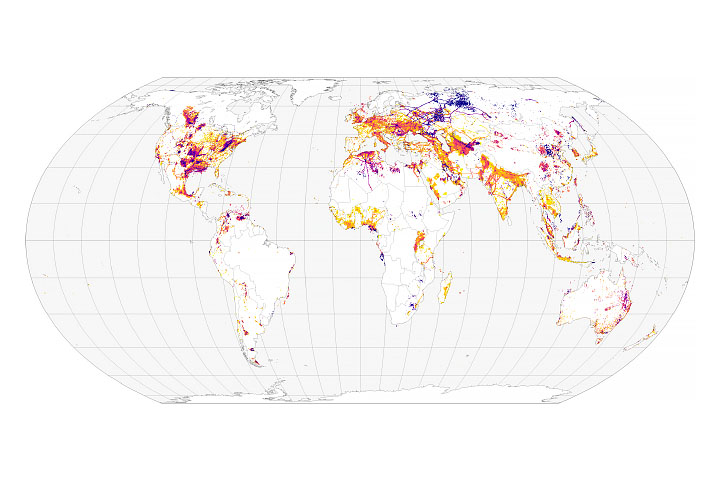
The map above shows the satellite-derived estimate of human-caused methane emissions for 2019. The science team compared this map to the EPA’s greenhouse gas inventory from the same year. They found that satellite-derived methane emissions for 2019 appeared to be 13 percent higher than EPA’s estimate (which is within, but at the high end, of EPA’s uncertainty range of +/-14 percent). The lightest yellows in the satellite-derived map show where emissions totaled 50 metric tons per square kilometer or more. (The highest values reached as much as 384 metric tons per square kilometer.)
The satellite and model-based estimates for oil and gas operations and livestock production, the two largest sources of methane in the U.S., were higher than EPA’s estimates by 12 percent and 11 percent respectively. Methane emissions from coal mining were 28 percent lower than in the EPA inventory.
Landfills, the third-largest source, emitted an estimated 50 percent more methane than the EPA inventory. High-emitting landfill operations are required to report their emissions every year through the Greenhouse Gas Reporting Program. While some landfills estimate their emissions based on the amount of waste stored and other landfill-specific information, other landfills infer emissions based on the amount of methane they capture and on operational information. Still, some sources of emissions, such as changes in operations or construction at the landfill, are not accounted for.

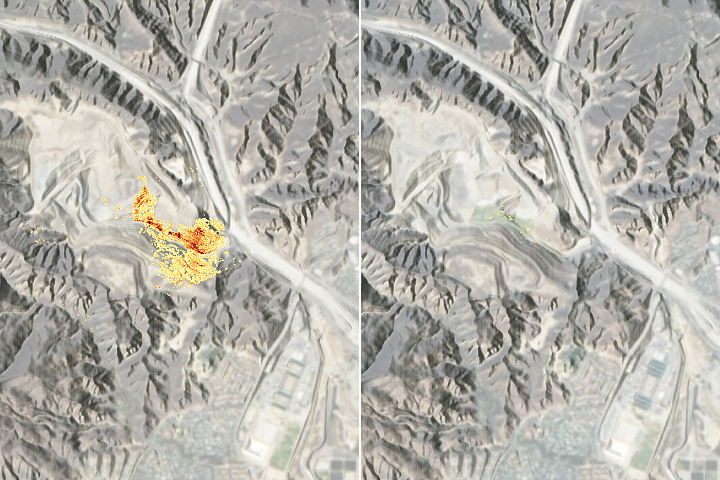
The science team zoomed in on a subset of 70 high-emitting landfills across the U.S. and found that emissions were 77 percent higher on median than what these facilities reported to the EPA. For the 38 of the 70 facilities that recovered gas, their emissions averaged 200 percent greater than reported. The map above shows the difference between what was reported to the EPA for these 70 landfills and the satellite-derived methane emissions for 2019.
The science team correlated their results with observations made from aircraft. Airborne observations can help refine satellite estimates of greenhouse gases, especially when landfills are located near other methane sources, such as wetlands or oil and gas operations.
This analysis shows that methane emissions from some sources are larger than previously thought, said Ben Poulter, a research scientist at NASA’s Goddard Space Flight Center. But he pointed out that remote sensing now provides additional monitoring resources that can support the mitigation of those emissions through various management practices.
Comparing the detailed satellite-based estimates to the EPA’s state-level inventories, the team found that emissions from the 10 top methane-producing states were, on average, 27 percent higher in 2019. Those 10 states were responsible for 55 percent of U.S. human-caused methane emissions.
EPA, NASA, NOAA, and NIST are working together as part of the U.S. Greenhouse Gas Center to provide regular updates to EPA’s gridded methane inventory system. They are also developing a gridded time series of natural methane emissions and sinks in the United States, and tracking large methane emission events by leveraging new observations.
NASA Earth Observatory images by Michala Garrison, using data from Nesser, et al. (2024). This research was supported in part by NASA’s Carbon Monitoring System (CMS). Story by Emily Cassidy.
alert message