The Earth Observatory has published its last Image of the Day on this website. Please join us on our new home at science.nasa.gov/earth/earth-observatory.
When NOAA released its 2020 numbers for atmospheric methane, many scientists were surprised.
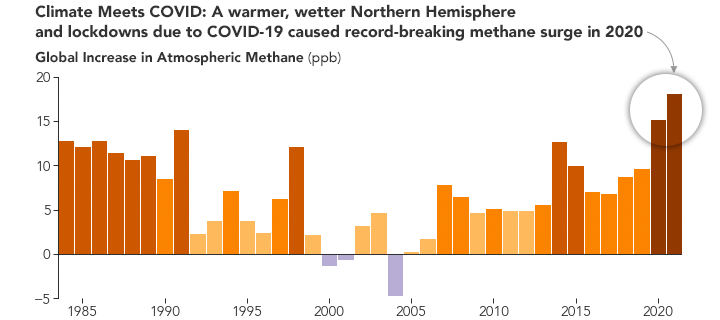
Though economic data showed that COVID-19-related lockdowns had led to improvements in air quality and reductions in carbon dioxide emissions, atmospheric methane still soared—above 1900 parts per billion and nearly triple pre-industrial levels. The annual growth rate for 2020 was the highest scientists had recorded since systematic annual methane measurements began in 1983—an increase of 15 parts per billion, which was exceeded again in 2021.
Climate scientists consider methane to be the second-most important anthropogenic greenhouse gas after carbon dioxide. Twenty-eight times more potent than carbon dioxide over 100-years, it has contributed 15 to 45 percent of the 1.1°C (2°F) of warming Earth has experienced since 1880. The gas also contributes to the formation of tropospheric ozone, which can harm human health and agriculture.
“The increase in the growth rate in 2020 was large, unexpected, and alarming,” said Ben Poulter, an earth scientist at NASA’s Goddard Space Flight Center. Methane concentrations had plateaued between 2000 and 2006, but as they began to rise between 2007 and 2019, the annual growth rate hovered around 9 parts per billion per year.
For years, scientists have struggled to explain exactly why atmospheric methane concentrations are rising so quickly, partly because of how many different processes produce the gas and partly because the removal processes are difficult to measure. The decay of organic matter in wetlands, fossil-fuel extraction and use, digestion by ruminant animals, the burning of biomass by fires, the thawing of permafrost, the breakdown of materials in landfills, seeps in the ocean and freshwater lakes, and even termites are among the many sources of the gas.
“We don’t have all the data and monitoring capabilities that we need to get a completely definitive answer for why concentrations of methane are rising so quickly,” said Poulter. “But with the information we do have, we’re seeing strong evidence that the increase in 2020 was driven by sharp increases in emissions from wetlands as well as, paradoxically, decreases in emissions of nitrogen oxide (NOx) pollution due to COVID-19 lockdowns that indirectly slowed the removal of methane from the atmosphere.”
An international group of scientists including researchers from Peking University, Le Laboratoire des Sciences du Climat et de l'Environnement (LSCE), The Norwegian Institute for Air Research, NOAA, NASA, California Institute of Technology, University of Maryland, and Tsinghua University reported their findings in Nature in December 2022.
The team came to their conclusions by analyzing a combination of “bottom up” emissions inventories from human activity data and biogeochemical model simulations and “top down” modeling estimates based on data from atmospheric methane observations, explained atmospheric scientist Xin Lin from LSCE, who co-led the study. They also used data from Japan’s Greenhouse Gases Observing Satellite (GOSAT) and NASA satellites to help validate the findings.
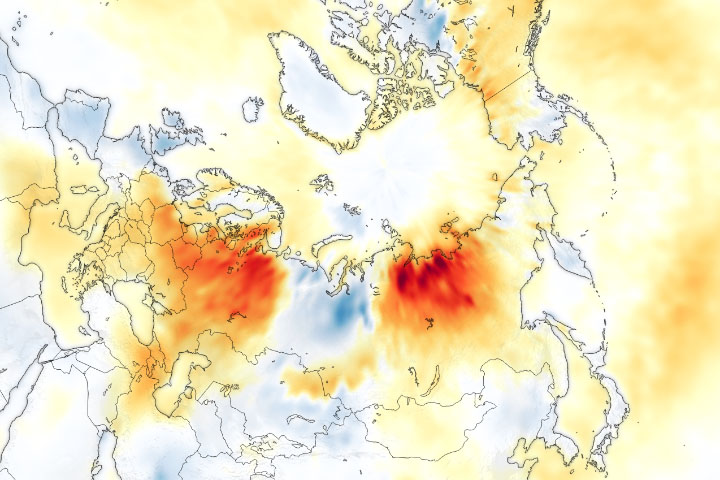
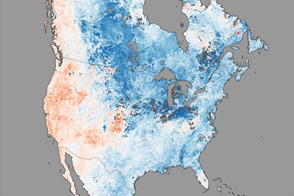
The research team attributed about half of the increase in the 2020 growth rate to heightened emissions from wetlands. “Most of the world’s wetlands were exposed to unusually high temperatures and more rainfall than usual in 2020, particularly in the Northern Hemisphere. Northern wetlands were about half a degree warmer relative to 2019, and precipitation over global wetlands increased by 2 to 11 percent,” explained Shushi Peng, an earth system scientist at Peking University and lead author of the study. This likely caused wetlands to expand, brought earlier soil thaw and later soil freeze dates, and may have increased emissions from permafrost and thermokarst lakes.
The scientists attributed the other half of the increase in the growth rate to a decline in emissions of NOx due to COVID-19 lockdowns. NOx, an air pollutant released by burning fossil fuels, triggers a chain of chemical reactions that produce a reactive compound called hydroxyl (OH), which serves as an atmospheric “detergent” by reacting with methane and removing it from the atmosphere, explained Lin.
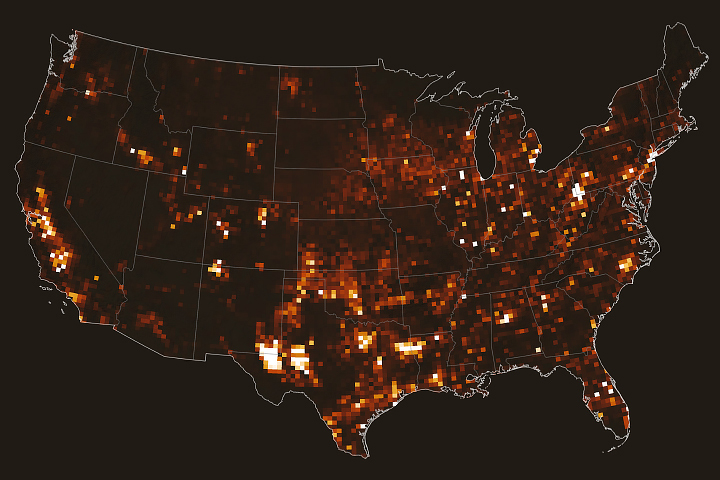
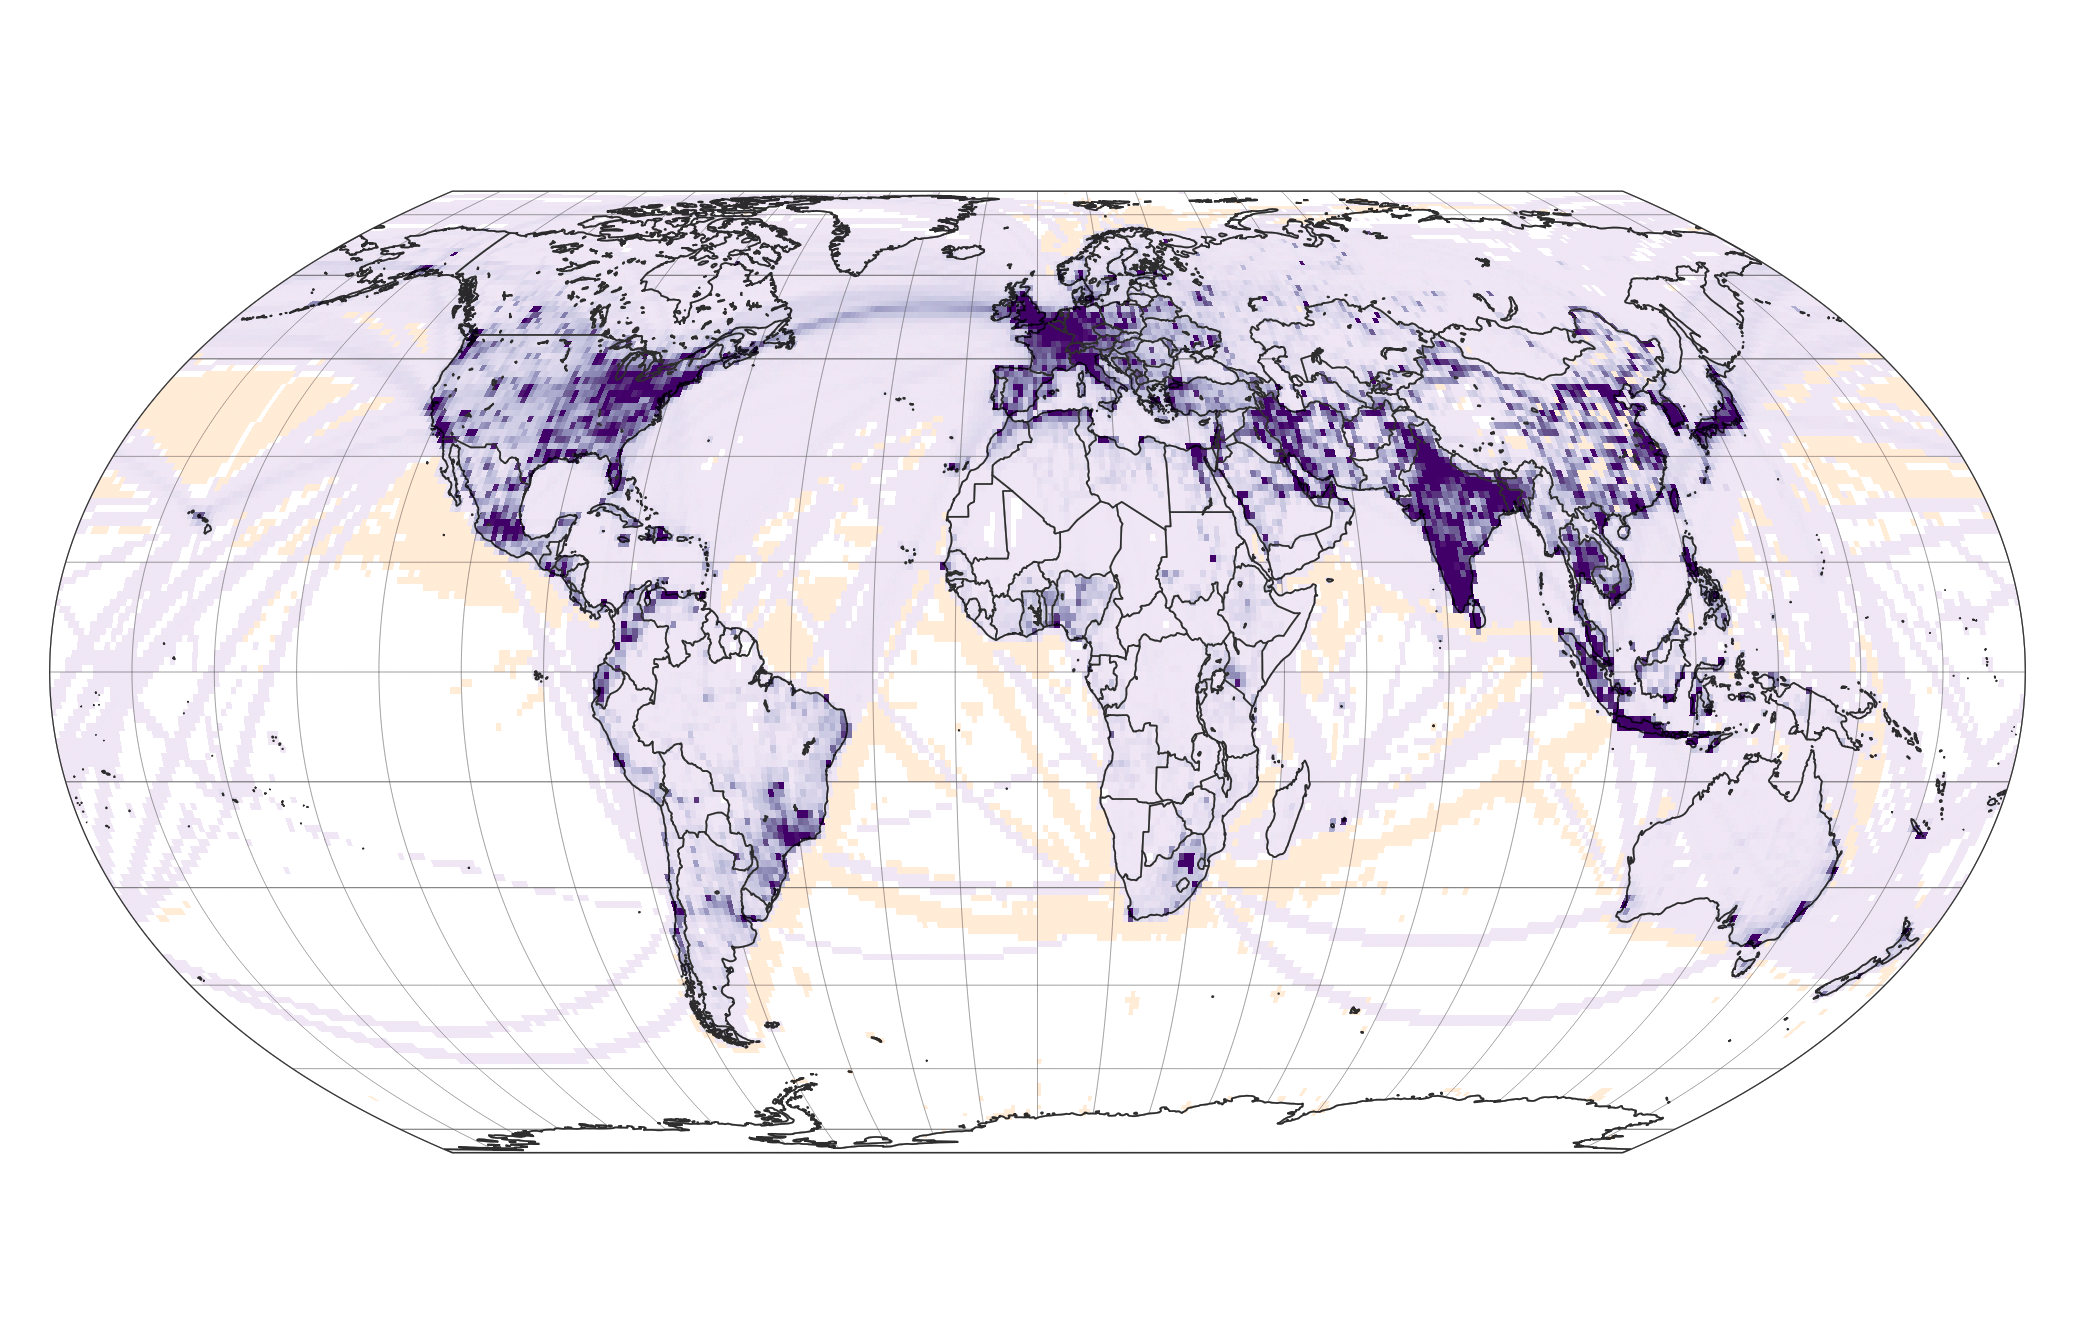
The map at the top of the page offers a global view showing where NOx emissions declined during 2020 due to the reduction in transportation and industrial activity during the first year of the COVID-19 pandemic. Densely populated areas in North America, Europe, and Asia all saw significant declines (purple). The map is based on data from the Community Emissions Data System, which is partially supported by NASA’s Atmospheric Composition Modeling and Analysis Program. It was extended to 2020 based on near real-time anthropogenic emissions from Carbon Monitor.
“People tend to focus on the sources of methane emissions, but this is a reminder that the processes that remove methane from the atmosphere, especially the amount of hydroxyl in the atmosphere, are critically important for controlling atmospheric methane,” said Poulter.
It is possible that changes in hydroxyl had an impact on the plateau in emissions in the early 2000s, though scientists have also theorized that droughts and improved control of methane leaks may have played a role as well. “No one can say definitively what happened to cause that plateau—and the science has moved on to understand the renewed growth,” added Poulter.
“Our research about the 2020 surge is also a reminder that policymakers cannot consider pollutants in isolation. There is a ripple effect associated with cleaning up NOx that they have to account for when thinking about how to manage methane emissions,” said Poulter.
Because methane is such a potent greenhouse gas, especially in the short-term, many climate scientists say that limiting methane emissions is one of the most promising methods to slow the pace of global warming and achieve the goal of limiting that warming to 1.5–2°C above pre-industrial temperatures.
But there is little sign of this happening yet. The 2021 growth rate for methane was even higher than the 2020 rate, rising from 15.3 parts per billion in 2020 to 17 parts per billion in 2021. “We need to do more analysis to confirm this, but my fear is that we’re seeing the beginning of a worrisome feedback cycle in which climate change leads to more intense rains and warmer temperatures, which leads to more methane emissions from wetlands, which leads to even more warming, and so on,” said Poulter.
NASA Earth Observatory images by Joshua Stevens, using data courtesy of Peng, S., et al. (2022). The video, produced by Kathleen Gaeta and Mark Subbaro, was originally published by NASA’s Scientific Visualization Studio. Story by Adam Voiland, with fact-checking by Benjamin Poulter (NASA).