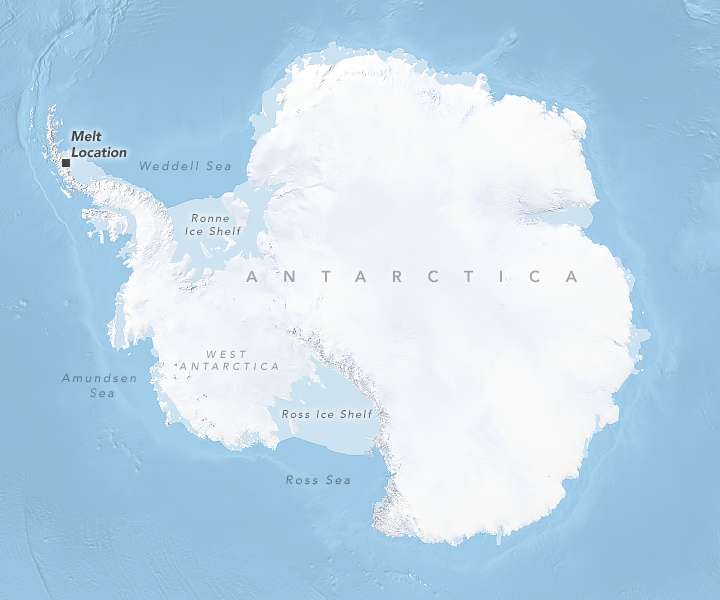

During the peak of austral summer, from December to February, jewel-toned patches of water form atop the snow and ice on the Antarctic Peninsula. Such melting is usually spurred by the heat of the Sun, an indication that the seasonal melt is underway. But new research shows how the Sun is not the only reason for melt on the ice surface.
These images, acquired on March 3, 2016, by the Operational Land Imager (OLI) on Landsat 8, show melting during an unusual, late-season event on the peninsula. The melting was caused by a hot, dry weather pattern known as foehn winds.
In the images, melting is focused in the foothills of the mountains near Cabinet Inlet, on the Larsen C ice shelf. Air masses are forced up and over the mountains, and they warm as they descend on the lee side. This produces a very localized pattern of melting. In contrast, melting from summer sunlight would appear more widespread across the shelf.

The March 2016 event was just one case of wind-induced melting that has been investigated by Rajashree Tri Datta, a postdoctoral scientist at NASA’s Goddard Space Flight Center. Datta used satellite observations and models to identify the timing of foehn winds, to estimate the amount of surface melting they produced between 1982 and 2017, and to show the effects of this melt on the snowpack.
The research, published on April 11, 2019, in Geophysical Research Letters, confirms that foehn winds—which are at their strongest outside of the summer season—have caused significant late-season melting on the Larsen C ice shelf in each year since 2015.
“The seasonality is extremely important,” Datta said. “The battery of late-season melt events in this region has the potential to change the snowpack in a permanent way.”
In a typical year, melt that occurs in summer is later replenished with new snow. But in areas where warm winds extend the melt season into autumn, the ice shelf is robbed of that replenishment. The snow near the surface becomes increasingly dense. By the time the following melt season arrives, the denser surface of the snowpack allows it to hold even more ponded water. This water can potentially work its way into cracks in the ice and promote break up.
“The density of the northern Larsen C ice shelf is already similar to that of the Larsen A and Larsen B ice shelves before they broke up,” Datta said. “These late-season melt events can increase that density, even if overall surface melt declines. This is important because the density of an ice shelf is one of the ways that we quantify how healthy it is—how vulnerable it is to collapse.”

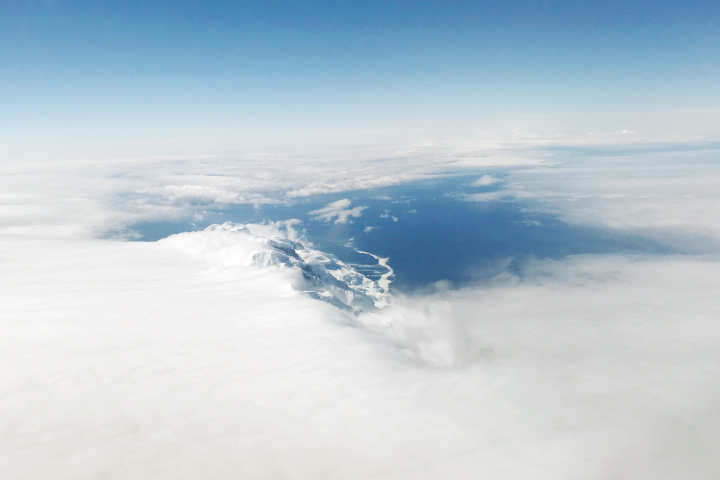
The study was partly provoked by flights on NASA’s Operation IceBridge, an airborne mission that makes annual research flights over polar ice. The photograph above, shot by IceBridge project scientist Nathan Kurtz, shows the effect of foehn winds on the Antarctic Peninsula in October 2017. Most of the moisture is on the windward side of the mountains, with a distinct clearing on the lee side.
Datta, onboard the research flight that day, had long thought about how to best represent foehn winds and surface melt with models. But until then, she had never seen Antarctica in person.
“The IceBridge mission scientist thinks about wind on the peninsula in terms of logistics. The pilot thinks about it in terms of danger. But for me, a modeler, the concept was never so concrete,” Datta said. “While in the field, I found myself looking for patterns in model outputs that made sense with what I was seeing right out of my window. That experience helped me appreciate the complexity of the question.”
NASA Earth Observatory images by Lauren Dauphin, using Landsat data from the U.S. Geological Survey and using Reference Elevation Model of Antarctica (REMA) data from the Polar Geospatial Center at the University of Minnesota. Story by Kathryn Hansen.