The Earth Observatory has published its last Image of the Day on this website. Please join us on our new home at science.nasa.gov/earth/earth-observatory.
Data visualizers and remote sensing scientists make true- or false-color images in order to show the features they are most interested in, and they select the wavelength bands most likely to highlight those features.
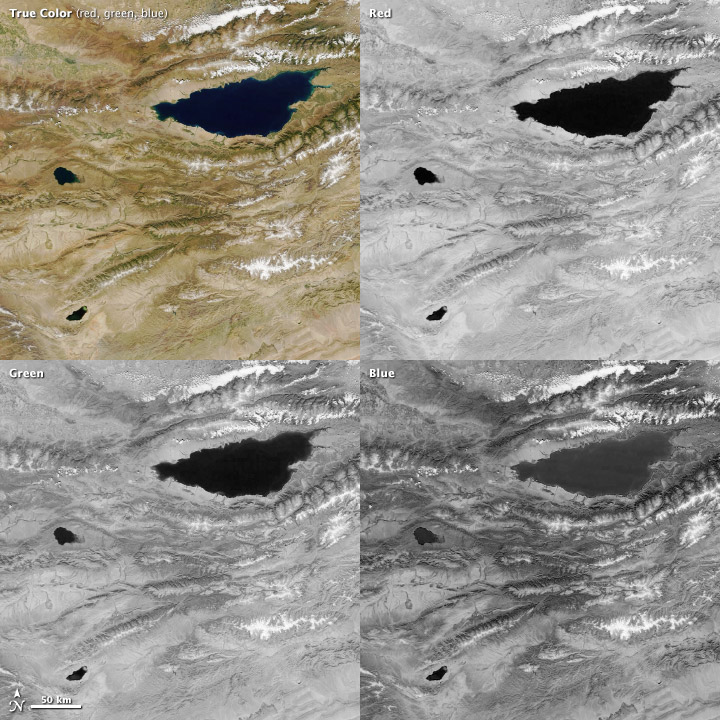
Combining red, green, and blue bands results in a true-color satellite image, such as this view of Lake Issyk Kul, Kyrgyzstan. (MODIS image from NASA Worldview.)
Blue light (450 to 490 nanometers) is among the few wavelengths that water reflects (the rest are absorbed). Hence, blue bands are useful for seeing water surface features and for spotting the sea- or lake floor in shallow waters. You can see that water reflects some blue light in the above image of Lake Issyk Kul, Kyrgyzstan. Water is lighter in the blue band than it is in either the red or green bands, though the lake is too deep for shallow features to be visible. Manmade creations like cities and roads also show up well in blue light. It is also the wavelength most scattered by particles and gas molecules in the atmosphere, which is why the sky is blue.
Green light (490 to 580 nanometers) is useful for monitoring phytoplankton in the ocean and plants on land. The chlorophyll in these organisms absorbs red and blue light, but reflects green light. Sediment in water also reflects green light, so a muddy or sandy body of water will look brighter because it is reflecting both blue and green light.
Red light (620 to 780 nanometers) can help distinguish minerals and soils that contain a high concentration of iron or iron oxides, making it valuable for studying geology. In the above image, for example, the exposed ground around Lake Issyk Kul varies in tone from pale tan to orange based on the mineral content of the soil. Since chlorophyll absorbs red light, this band is commonly used to monitor the growth and health of trees, grasses, shrubs, and crops. Red light can also help distinguish between different types of plants on a broad scale.
