The Earth Observatory has published its last Image of the Day on this website. Please join us on our new home at science.nasa.gov/earth/earth-observatory.
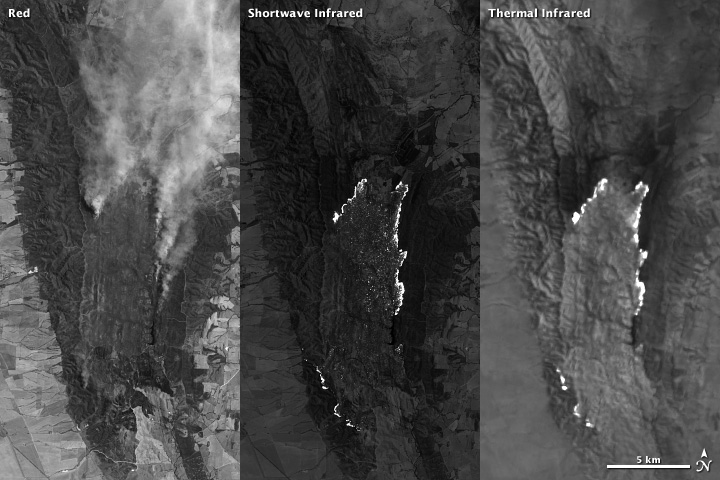
Satellite instruments carry many sensors that are each tuned to a narrow range, or “band,” of wavelengths (just red or green light, for instance). Viewing the output from just one band is a bit like looking at the world in shades of gray. The brightest spots are areas that reflect or emit a lot of that wavelength of light, and darker areas reflect or emit little (if any).
To make a satellite image, we choose three bands and represent each in tones of red, green, or blue. Because most visible colors can be created by combining red, green, and blue light, we then combine the red, green, and blue-scale images to get a full-color representation of the world.
A natural or “true-color” image combines actual measurements of red, green, and blue light. The result looks like the world as humans see it. (For tips on understanding true-color images, read How to Interpret a Satellite Image on the Earth Observatory.")
A false-color image uses at least one non-visible wavelength, though that band is still represented in red, green, or blue. As a result, the colors in the final image may not be what you expect them to be. (For instance, grass isn’t always green.) Such false-color band combinations reveal unique aspects of the land or sky that might not be visible otherwise.
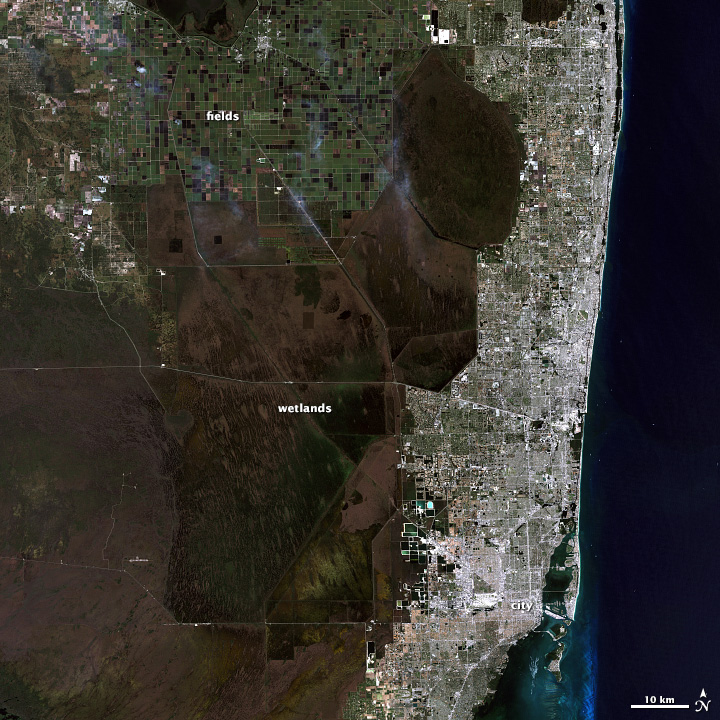
This series of Landsat images of southeastern Florida and the Northern Everglades illustrates why you might want to see the world in false color. (A related animation shows how the images were made.) The visible light image shows dark green forest, light green agriculture, brown wetlands, silver urban areas (the city of Miami), and turquoise offshore reefs and shallows. These colors are similar to what you would see from an airplane.
The second image shows the same scene in green, near infrared, and shortwave infrared light. In this false-color band combination, plant-covered land is bright green, water is black, and bare earth ranges from tan to pink. Urban areas are purple. Newly burned farmland is dark red, while older burns are lighter red. Much of the farmland in this area is used to grow sugar cane. Farmers burn the crop before harvest to remove leaves from the canes. Because burned land looks different in this kind of false-color image, it is possible to see how extensively farmers rely on fire in this region.
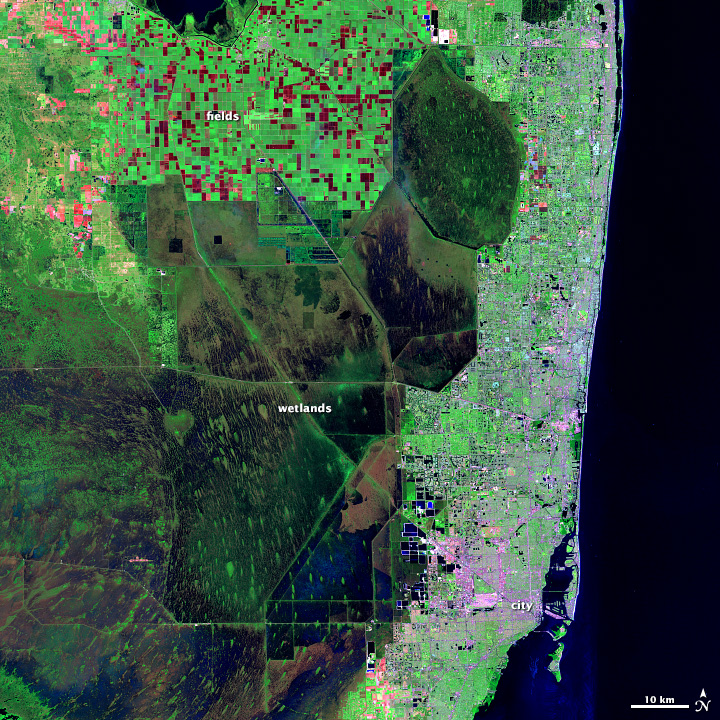
This false-color image of Florida combines shortwave infrared, near infrared, and green light. (NASA image by Matt Radcliff with Landsat 5 data from the USGS Earth Explorer.)
This false-color view also reveals how water flows through the Northern Everglades. Green islands punctuate the wetlands, which are black and blue. These are tree islands that are hard to distinguish in natural color. Their orientation aligns with the flow of the water, highlighting direction that is not obvious in the natural color image. It is also easier to see the extent of the wetlands against surrounding land, since water is dark in this view and plant-covered land is bright green.
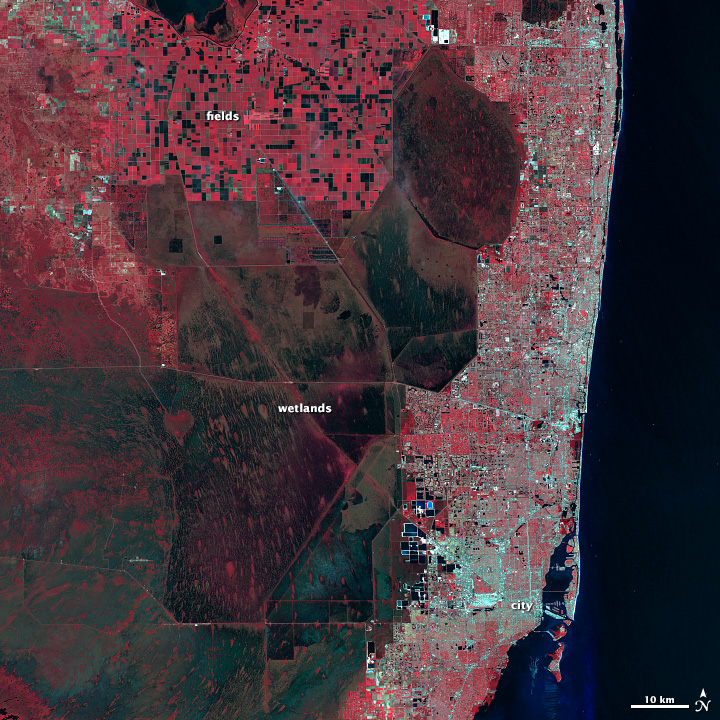
Southeast Florida is shown in near infrared, red, and green light. (NASA image by Matt Radcliff with Landsat 5 data from the USGS Earth Explorer.)
The third image shows the scene in green, red, and near infrared light. Plants are dark red because they reflect infrared light strongly, and the infrared band is assigned to be red. Plants that are growing quickly reflect more infrared, so they are brighter red. That means that this type of false-color image can help us see how well plants are growing and how densely vegetated an area is. Water is black and blue, and urban areas—including Miami, Fort Lauderdale, and West Palm Beach—are silver.
