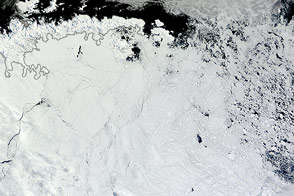
Winds pushed Antarctic sea ice north of its typical location in February 2013.
Published Mar 1, 2013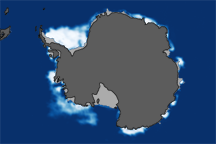
This pair of images shows Antarctic sea ice concentrations at the 2008 winter maximum and the 2009 summer minimum compared to the median ice extent from 1979–2000.
Published May 23, 2009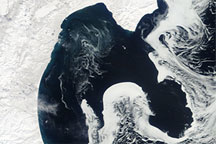
Acquired April 13, 2010, this natural-color image shows a long formation of sea ice with a shape that mimics the features of the eastern shore of the Kamchatka Peninsula.
Published Apr 15, 2010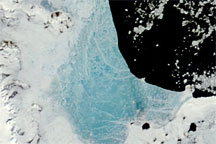
Changing weather conditions left their mark on sea ice along the Antarctic Peninsula in late 2008 and early 2009. In mid-December 2008, melt water resting on the sea ice colored it sky blue. At the beginning of 2009, however, the sea ice appeared snowy white, and cracks had begun along the ice margin.
Published Jan 9, 2009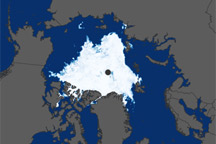
These satellite-based maps show sea ice concentration in the Arctic and Antarctic during September 2008 and February 2009, the months of the sea ice maximums and minimums in the respective hemispheres.
Published Apr 21, 2009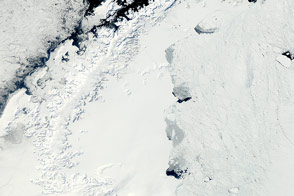
The MODIS instrument on NASA’s Aqua satellite captured this clear view of the Antarctic Peninsula, the Larsen Ice Shelf, and the sea ice covered waters around the region in October 2011.
Published Oct 15, 2011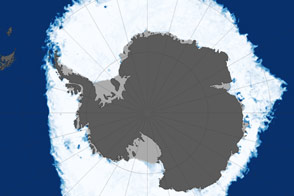
This map shows sea ice extent around Antarctica on September 22, 2013, when ice covered more of the Southern Ocean than at any other time in the satellite record.
Published Oct 1, 2013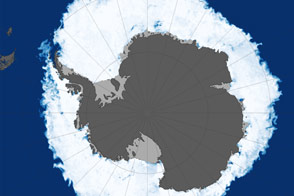
In 2015, the annual maximum extent of Antarctic sea ice dropped below previous consecutive years of record highs.
Published Oct 18, 2015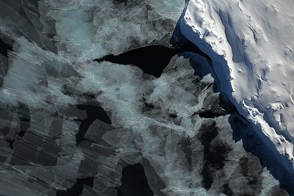
A spectacular view of sea ice was captured during an Operation IceBridge flight in 2014; the mission surveyed ice at both poles again in 2015, this time simultaneously.
Published Oct 4, 2015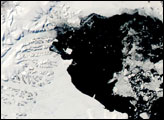
alert message
