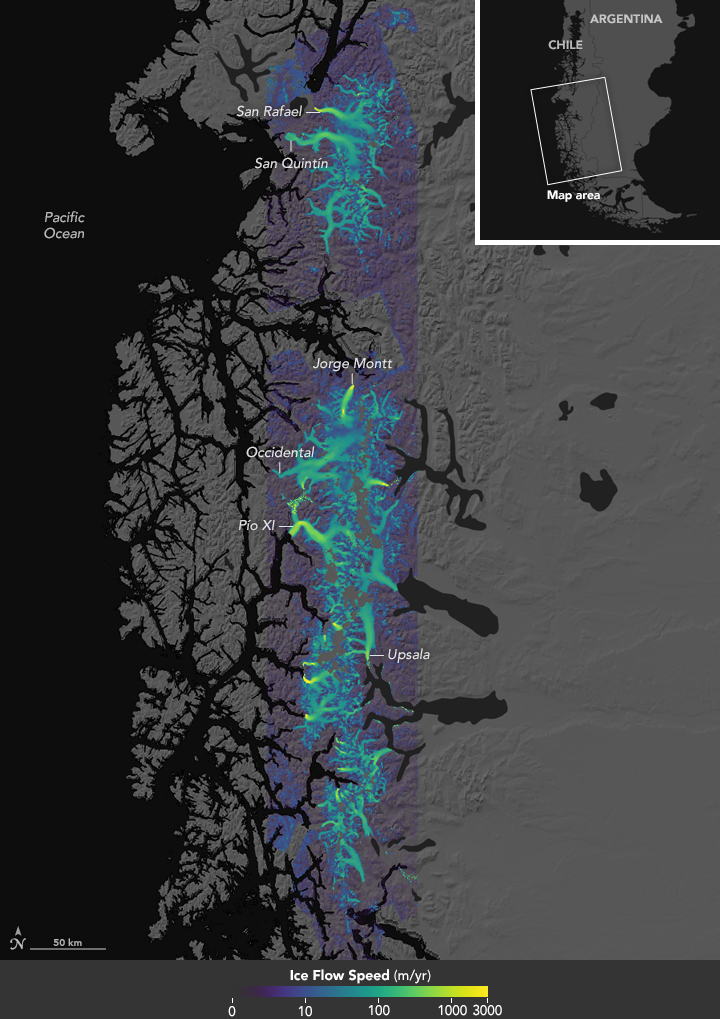


“The glaciers of Patagonia are some of the most temperate, fastest, and most erosive glaciers on Earth,” notes Michele Koppes, a glaciologist from the University of British Columbia. “The moist, warm climate drives very fast flow and allows the glaciers to do a lot of work on the landscape, carving deep fjords in one one-hundredth the time it takes similar glaciers in the polar regions to create the same landscapes.”
Scientists have long wondered: how fast is Patagonia’s ice changing? Over the years, they have mapped the velocities of a few of the outlet glaciers. (These ring the perimeter and drain the icefields.) Then in 2015, Jeremie Mouginot of University of California, Irvine, and Eric Rignot of NASA’s Jet Propulsion Laboratory published the first thorough, high-resolution mosaic of ice speed across the icefields.
The results of their work are shown in the map above. The ice velocities were derived from radar interferometry observations collected from multiple satellites between 1984 and 2014. Interferometry is a technique that uses precise measurements of changes in distance between the satellite and points on the ground to calculate the speed of relatively slow-moving features on Earth. Because the map is a mosaic of data that spans two decades, it can be interpreted as a general representation of conditions at the median year (2004). Large local changes, however, can occur between season and years.
“The only way we could map entirely the ice speed of the ice fields was to put together acquisitions from six different space satellites operated during the last 30 years,” Mouginot said. “The result actually revealed a very different picture of ice velocities. By completely redefining the glacier extents into the ice fields, we showed that the glaciers may have a more significant and widespread influence on the mass balance of the region than previously thought.”
Ice is moving at a huge range of speeds across Patagonia, from as little as a few centimeters to as much as 10,000 meters per year. In this map, yellow areas are moving the fastest and purple areas are the slowest. Notice the significant amount of green; almost half of the ice is moving at speeds faster than 100 meters per year.
“The difference in the waters—warm and salty in the west, and colder and fresher in the east—also controls the calving and internal dynamics of the outlet glaciers,” Koppes said. She notes that melting at the ice fronts due to ocean heat can draw down western glaciers at 5 to 10 times the rate of glaciers in the east.
San Rafael is the fastest moving glacier on the north icefield. It was flowing at about 7.6 kilometers per year in 1994, and has since decelerated. Perhaps the most notable glacier of the south icefield is Jorge Montt. Data show that the speed of this glacier more than doubled between 1986 and 2000. It then slowed down by 30 percent between 2000 and 2008, and accelerated again by 115 percent between 2008 and 2014.
“The spectacular retreat of Jorge Montt in the 1990s is explained by the bathymetry: the glacier retreated along a reverse bed during these years; that is, a bed that is getting deeper inland,” Rignot said. “This is an unstable configuration for the glacier, causing it to retreat rapidly until it reaches higher ground.”
The acceleration and retreat of Patagonia’s glaciers can have a multitude of effects on the landscape. The glaciers produce mounds of sediment that clog the rivers, fjords, and waterways; this alters aquatic habitats and reroutes water resources, according to Koppes. And along the western margin of the South Patagonian Icefield, ships that pass through the fjords must contend with the numerous icebergs that calve from the glacier fronts.
Koppes added: “Given ongoing climate change, the glaciers of the north and south Patagonia icefields are important predictors of what we expect to occur in the coming decades in other glaciated, high-latitude regions, such as the Antarctic Peninsula and the Canadian Arctic, which are experiencing some of the most rapid warming on the planet.”
NASA Earth Observatory image by Jesse Allen, using data courtesy of Mouginot, J., & Rignot, E. (2015). Story by Kathryn Hansen.