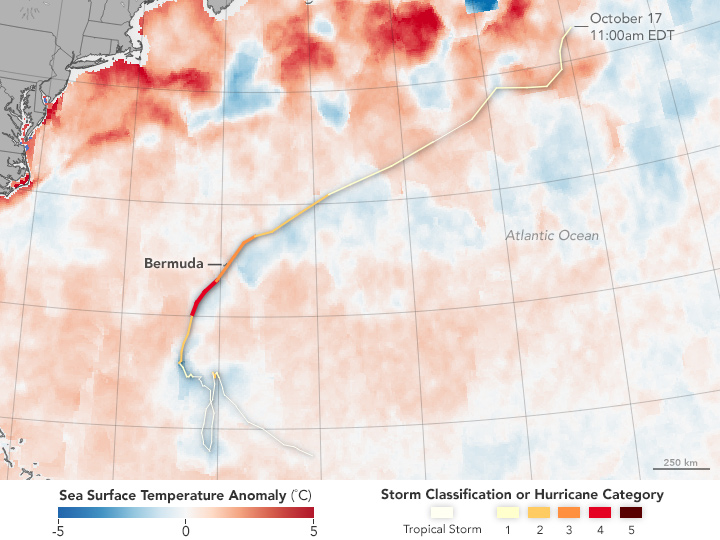


When Hurricane Nicole blew across the Atlantic and over Bermuda in October 2016, the storm stirred up the ocean and left a distinctive pattern in its wake. Sea surface temperature data reveals Nicole’s impact on the waters it passed over.
Hurricanes feed off warm ocean surface temperatures, like a fire relies on a steady oxygen supply to keep burning. The warm, relatively shallow layer at the top of the ocean provides much of the fuel to develop and sustain a storm.
As the storm passes over the sea, it can mix up the water column, said Scott Braun, a research meteorologist at NASA's Goddard Space Flight Center. If a storm is moving quickly, it pushes forward into new, warm water masses without losing energy. But if a storm moves slowly, it can sap its own strength.
“If the hurricane mixes the [top] layer of the ocean, it taps into colder water below,” said Braun. When the storm cools the surface, it reduces the intensity of the weather system while making it less likely for new storms to form in its wake (over the short term).
The map above shows sea surface temperatures anomalies, not absolute temperatures. It depicts how much water temperatures were above or below the long term average for October. The map was built using data from the Microwave Optimally Interpolated SST product. The sensors track microwave and infrared light emissions from the sea surface in order to capture the temperature of the top few millimeters of water. Some of those measurements come from the Moderate Resolution Imaging Spectroradiometer (MODIS) on NASA’s Terra satellite.
In the case of Hurricane Nicole, the waters south of Bermuda reflect its slow advance for a week of development before it became a full-blown hurricane. The cold water wakes are evenly distributed on both sides of the storm track, a sign of its plodding pace and the ocean mixing occurring below. The cool water even reflects the loop in Nicole’s path that temporarily weakened the storm.
As the storm sped up—as it approached and moved past Bermuda—colder water mostly appears on the right side of the track. “The ocean is responding to where winds are strongest, and that’s why you get most cooling on the right side,” Braun said. The stronger winds on the right side of the storm stirred up more of the water column, leaving a lop-sided wake.
NASA Earth Observatory image by Jesse Allen, using MWIROI-SST data from Frank Wentz, Remote Sensing Systems. Caption by Pola Lem.