
When a nor’easter came barreling through the Mid-Atlantic in late January 2016, it brought remarkably strong winds and a formidable storm surge, along with historic amounts of snow.
The map above was produced with data from RapidScat, a sensor mounted on the International Space Station. Arrows represent the direction of near-surface winds and shades of blue indicate the range of wind speeds (lighter blue and green represent faster-moving winds) as the blizzard approached the coast on January 23, 2016. RapidScat observed strong winds along the Atlantic coast of Maryland, Delaware, and southern New Jersey. According to RapidScat, many coastal areas experienced winds gusts of 145 kilometers (90 miles) per hour or more—strong enough to be considered hurricane force.
Note that RapidScat does not measure wind speed and direction directly. Instead, microwave pulses from the instrument reflect off the ocean surface and back toward the sensor. Rough waters—those disturbed more by wind—return a stronger signal than smooth waters. From that information, scientists can derive wind speed and direction based on the position of the waves.

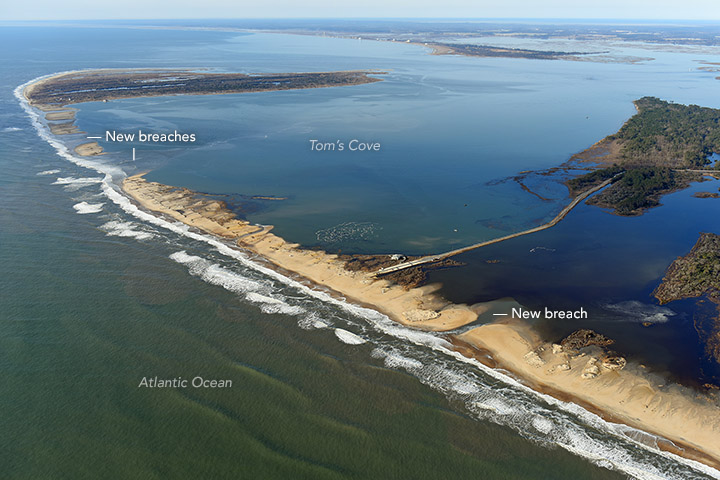
The potent winds piled up a storm surge that led to flooding and significant erosion along beaches and barrier islands. In New Jersey, the town of Cape May faced record-breaking coastal flooding. In Delaware, beaches in Rehoboth and Bethany lost sand dunes, according to news reports. In Virginia, aerial photographer Patrick Hendrickson captured an image (above) of several new breaches in a beach on Assateague Island. The beach helps protect launch infrastructure on Wallops Island, an area increasingly threatened by rising sea level.
NASA Earth Observatory map by Joshua Stevens, using RapidScat data from the Jet Propulsion Laboratory. Photograph contributed by Patrick Hendrickson of Highcamera. Caption by Adam Voiland.