
When Joaquin approached the Bahamas in late September 2015 as a tropical storm, meteorologists watched closely. It was clear that the storm would grow into a strong hurricane. But would forecast models converge on a storm path that moved Joaquin northwest toward the U.S. East Coast, or would the storm move eastward out to sea?
At 11:30 a.m. Eastern Time (15:30 Universal Time) on October 2, 2015, the Moderate Resolution Imaging Spectroradiometer (MODIS) on NASA’s Terra satellite acquired this view of Hurricane Joaquin over the Bahamas. The storm qualified as a Category-4 on the Saffir-Simpson scale, with maximum sustained winds reaching 115 knots (132 miles per hour).
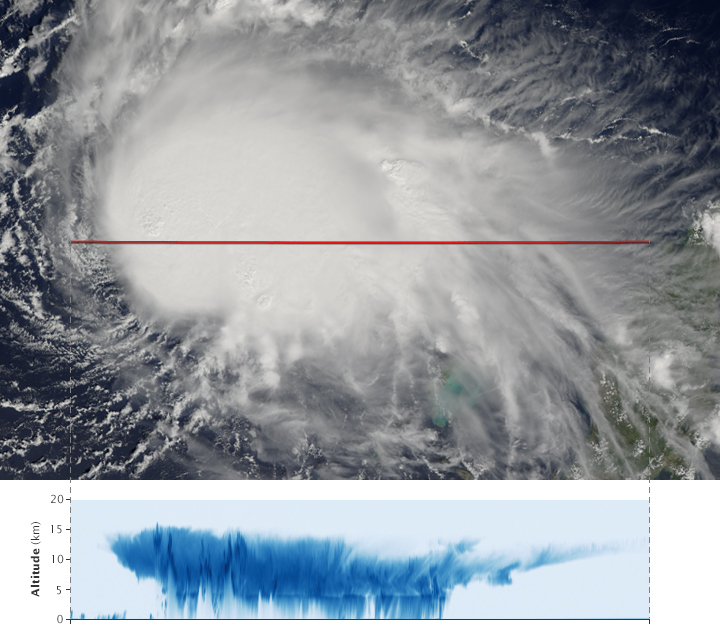
On the same day, the five-day forecast from the National Hurricane Center leaned toward an eastward, offshore trajectory out over the Atlantic Ocean. Still, people living along the East Coast prepared for uncertain amounts of rainfall that could affect the region in subsequent days. An example of the structure and precipitation within the storm is visible in the image pair below.

The vertical slice through Joaquin (bottom image), was acquired on September 29, 2015, with the cloud-profiling radar on the Cloudsat satellite. The instrument sends pulses of energy toward Earth and records the strength of the signals that bounce off ice and water particles.
Dark blues represent areas where clouds and raindrops reflected the strongest signal back to the satellite radar. These areas had the heaviest precipitation and the largest water droplets. The blue line in the center of the image is the freezing line; ice particles formed above it, raindrops below it.
For reference, the top image shows a natural-color view of the storm acquired on the same day with Moderate Resolution Imaging Spectroradiometer (MODIS) on NASA’s Aqua satellite. The red line is the south-to-north track that CloudSat took over the storm.
Joaquin is the third hurricane of the 2015 Atlantic season—on track with what forecasters had said would be a quiet season. The outlook delivered in May 2015 by the National Oceanic and Atmospheric Administration called for a 70 percent chance of a below-average season in the Atlantic Ocean.
NASA Earth Observatory images by Jesse Allen, using CloudSat FirstLook data provided courtesy of the CloudSat team at Colorado State University and Aqua MODIS data from the Land Atmosphere Near real-time Capability for EOS (LANCE). NASA Terra MODIS image by Jeff Schmaltz, LANCE/EOSDIS Rapid Response. Caption by Kathryn Hansen.