
Salinity—the amount of dissolved salt in the water—is critical to so many aspects of the ocean, from circulation to climate to the global water cycle. For much of the past year, NASA and Argentina’s Comisión Nacional de Actividades Espaciales (CONAE) have been making comprehensive observations of sea surface salinity from space. Launched on June 10, 2011, the Aquarius mission is slowly compiling a more complete picture of the salty sea and how it varies.
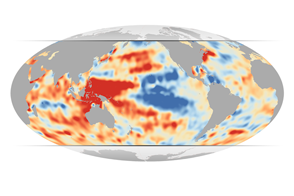
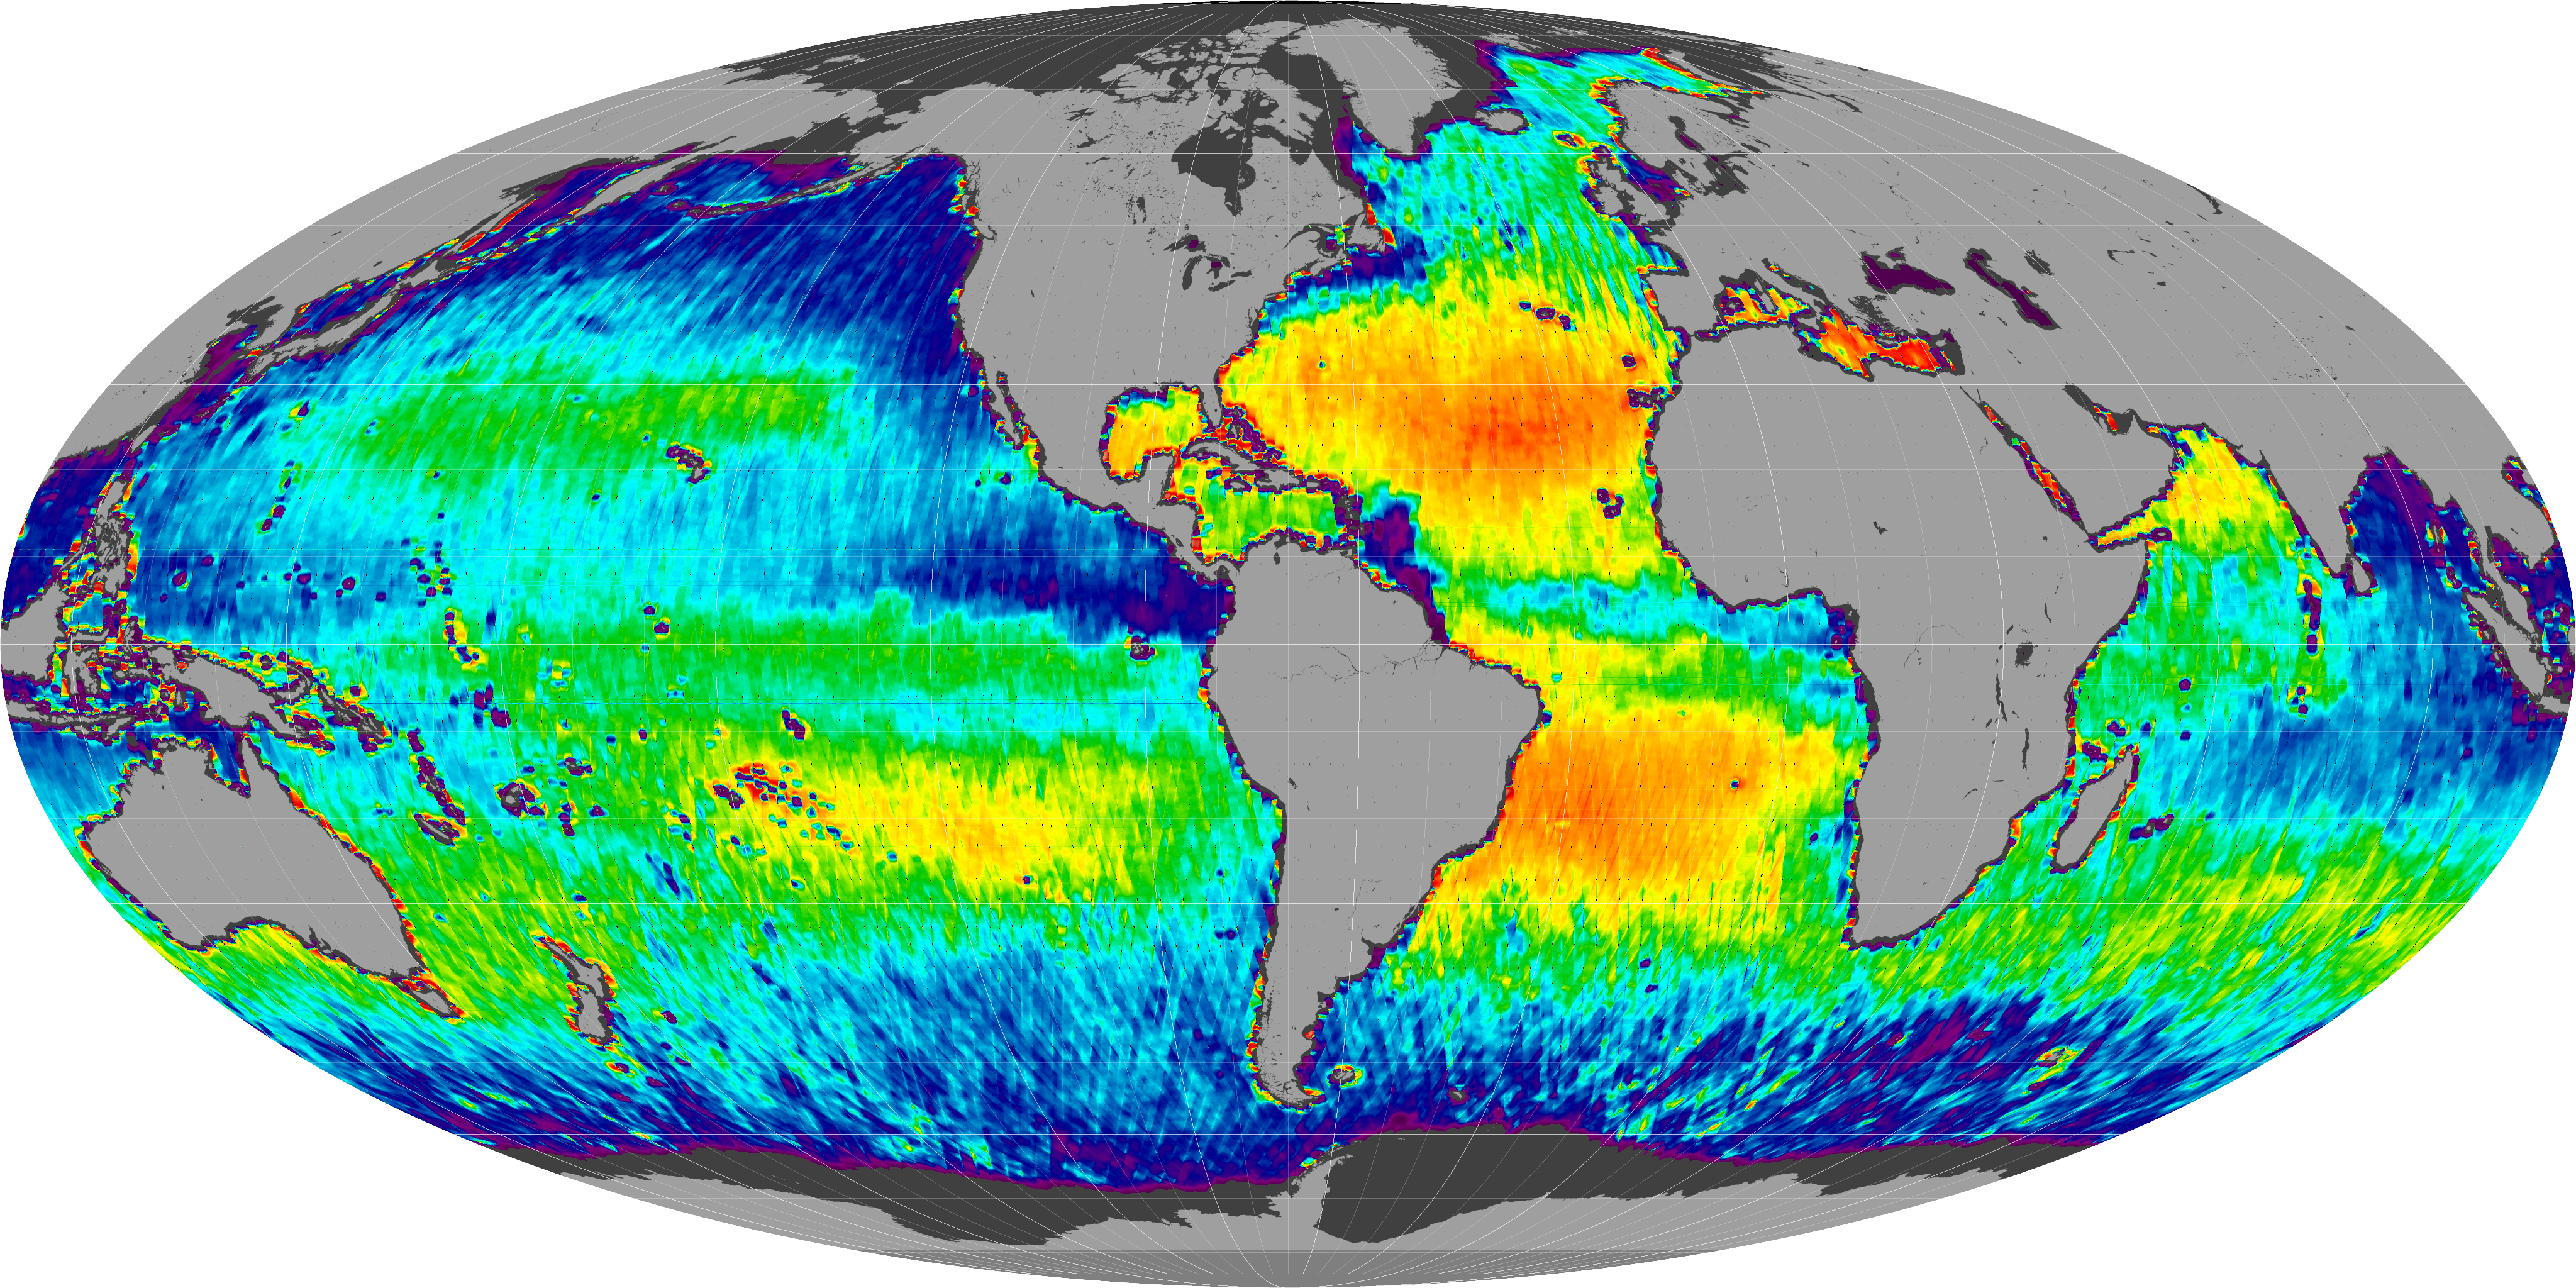
The map above shows salinity near the ocean surface as measured by the Aquarius instrument on the Satélite de Aplicaciones CientÃficas (SAC)-D satellite. The data depicted shows average salinity from May 27 to June 2, 2012, in a range from 30 to 40 grams per kilogram, with 35 grams being the average. Lower values are represented in purples and blues; higher values are shown in shades of orange and red. Black areas occur where no data was available, either due to the orbit of the satellite or because the ocean was covered by ice, which Aquarius cannot see through.
Click on the animation below the main image to see salinity patterns changing week by week over the past year. A few features stand out. As oceanographers have known for many years—but now can “see”—the Atlantic Ocean is saltier than the Pacific and Indian Oceans. Rivers such as the Amazon carry tremendous amounts of fresh runoff from land and spread plumes far into the sea. And in the tropics—particularly near the Pacific’s Inter-Tropical Convergence Zone—extra rainfall makes equatorial waters somewhat fresher.
Near most coastlines and inland seas in the map, waters appear much fresher or saltier than in open-ocean locations. Look, for instance, at the Red Sea and the Mediterranean for saltier waters; significantly fresher waters appear in the Black Sea, in the icy high latitudes, and around the many islands and peninsulas of Southeast Asia. Indeed, runoff from rivers and melting ice does make water fresher, and strong evaporation and other processes do make the Red and Mediterranean Seas saltier. But mostly those extreme salinity measurements around the coastlines are a distortion of the satellite signal.
Technically, Aquarius measures the emissivity or “brightness temperature” of the surface waters, notes Gary Lagerloef, Aquarius principal investigator, based at Earth and Space Research in Seattle. Land masses have a higher emissivity than the ocean, so any measurement close to land tends to be skewed by its brightness. Over time, the Aquarius research team should be able to calibrate the measurements and develop mathematical tools to better distinguish the salt signal. But for now, the measurements are so new that the team is still working on the big picture of ocean salinity.
Aquarius is the first NASA instrument specifically designed to study surface ocean salinity from space, and it does so at a rate of 300,000 measurements per month. It uses three passive microwave sensors, called radiometers, to record the thermal signal from the oceans' top 10 millimeters (about 0.4 inches).
“An overarching question in climate research is to understand how changes in the Earth’s water cycle—meaning rainfall and evaporation, river discharges and so forth—ocean circulation, and climate link together,” said Lagerloef. Most global precipitation and evaporation events take place over the ocean and are very difficult to measure. But rainfall freshens the ocean’s surface waters, and Aquarius can detect these changes in saltiness. “Salinity is the variable we can use to measure that coupling. It’s a critical factor, and it will eventually be used to improve climate forecasts.”
NASA images by Norman Kuring, Goddard Space Flight Center. Animation by Robert Simmon. Caption by Mike Carlowicz, Earth Observatory, with reporting from Maria-Jose Vinas, NASA Earth Science News Team.