

A storm’s strength is measured by wind speeds, and Tropical Cyclone Yasi brought sustained winds of 250 kilometers (155 miles) per hour, and gusts up to 305 kilometers (190 miles) per hour. High winds and waves, however, were not the only trouble this storm caused. Yasi also brought substantial rainfall.
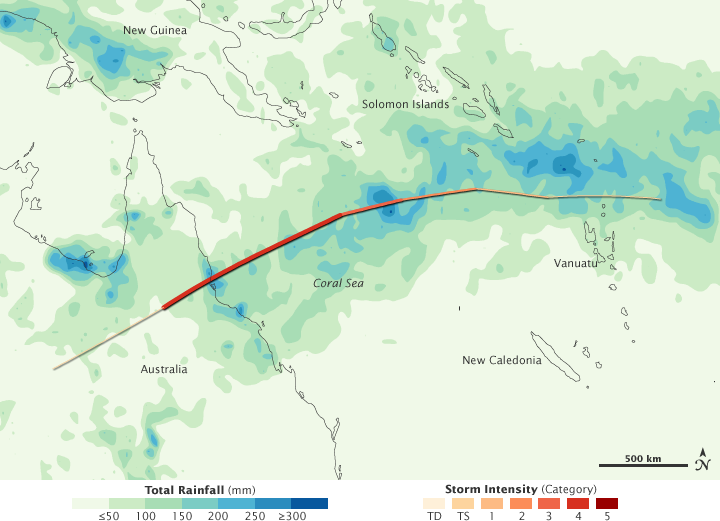
This image shows rainfall associated with Yasi from January 28 to February 3, 2011. The heaviest rainfall—more than 300 millimeters or nearly 12 inches—appears in dark blue. The lightest rainfall—less than 50 millimeters or about 2 inches—appears in light green. The storm track is superimposed on the rainfall amounts, with darker shades of pink indicating greater storm intensity.
This map shows heavy rainfall adhering fairly closely to the storm’s path, forming an arc of rain from east of Vanuatu to the Australian coast. Patches of intense rainfall also appear west of the storm track, including heavy precipitation over New Guinea.
Yasi arrived in the wake of earlier flooding in eastern Australia. Although the storm dissipated over land, its remnants continued to cause heavy downpours. Australia’s Bureau of Meteorology predicted widespread rain in the southeastern state of Victoria for February 4 and 5, as remnants of the ex-tropical cyclones Yasi and Anthony passed over the region. ABC News Australia reported thousands of calls for assistance as homes and businesses flooded in Victoria, and The Age reported flash floods in Melbourne.
NASA Earth Observatory image by Jesse Allen, using near-real-time data provided courtesy of TRMM Science Data and Information System at Goddard Space Flight Center. Caption by Michon Scott.