

Photo-like satellite images give us a view of the world that is relatively familiar to us; the images look a lot like a digital photo. But for many scientific studies, a photo-like image doesn't provide enough information. For example, to predict where the ash from an eruption may spread or how it might interact with clouds, scientists need a mathematical way to describe the concentration of particles in the air.
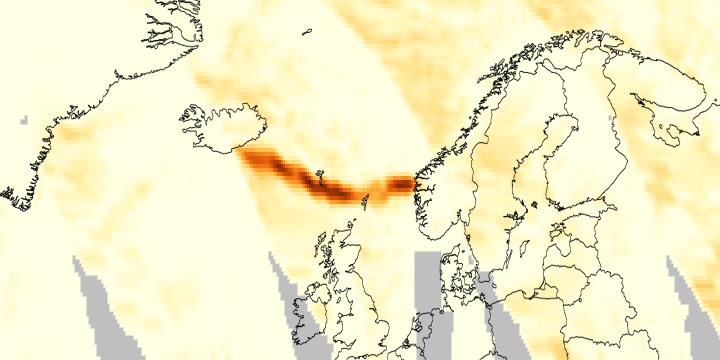
One way to describe the ash and other particles from an eruption is with an aerosol index, which is based on the way particles in the air affect the passage of visible or ultraviolet light through the atmosphere. This map shows the aerosol index over the North Atlantic following the eruption of Iceland’s Eyjafjallajökull Volcano in mid-April 2010. An index of less than 0.1 (palest yellow) indicates a haze-free sky, whereas a value of 5 (reddish brown) indicates very hazy conditions. If you were on the ground when the aerosol index was close to 5, the haze would likely be thick enough to hide the Sun.
Eyjafjallajökull is located at the southeastern corner of Iceland, and the April 15 plume spread thickly from there all the way across the Atlantic. It forced most European countries to close their airspace. (Volcanic ash cannot be detected by airplanes’ radars, and it can cause jet engines to fail.)
This image is based on data collected by the Ozone Monitoring Instrument (OMI) on NASA's Aura satellite in a series of orbits on April 15, 2010.
NASA image created by Jesse Allen, using data provided courtesy of Colin Seftor, Aura OMI Science team. Caption by Rebecca Lindsey.