The Earth Observatory has published its last Image of the Day on this website. Please join us on our new home at science.nasa.gov/earth/earth-observatory.
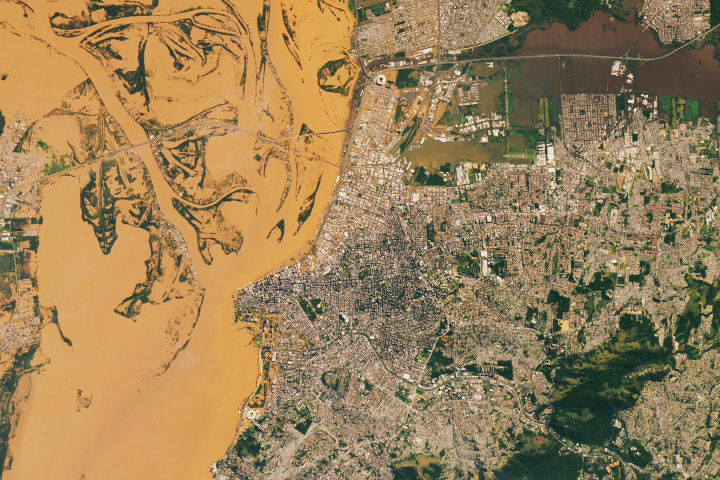
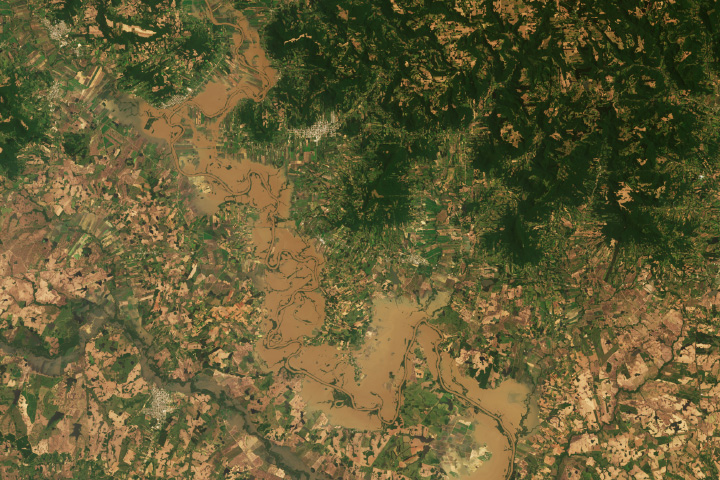
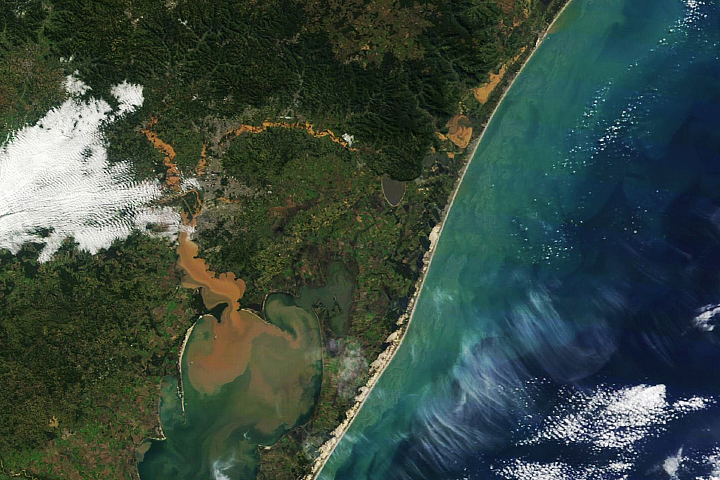
Storms and torrential rain battered southern Brazil beginning in late April 2024, causing deadly, destructive flooding that persisted through much of May. Toward the end of the month, parts of Rio Grande do Sul state remained underwater, and the scope of the damage became increasingly evident.
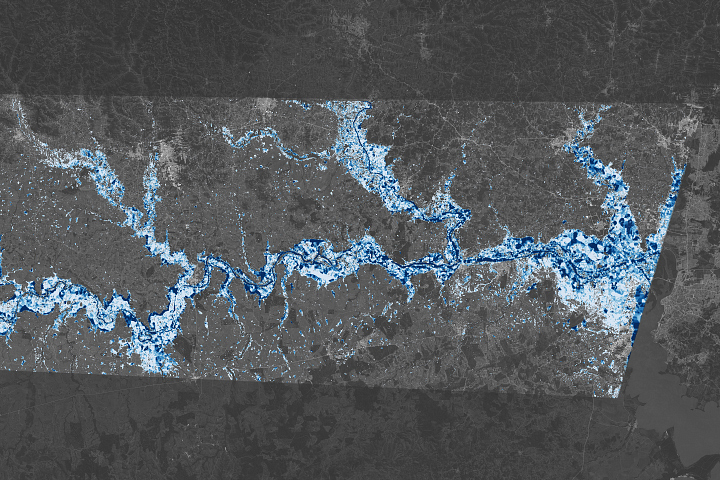
Maps of floodwater extent are one way to assess a flooding event. But information about the depth of that water is also useful, potentially aiding rescue and relief operations, informing decisions about road closures and accessibility, and contributing to analyses of damage and flood risk.
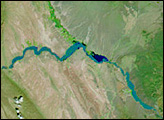
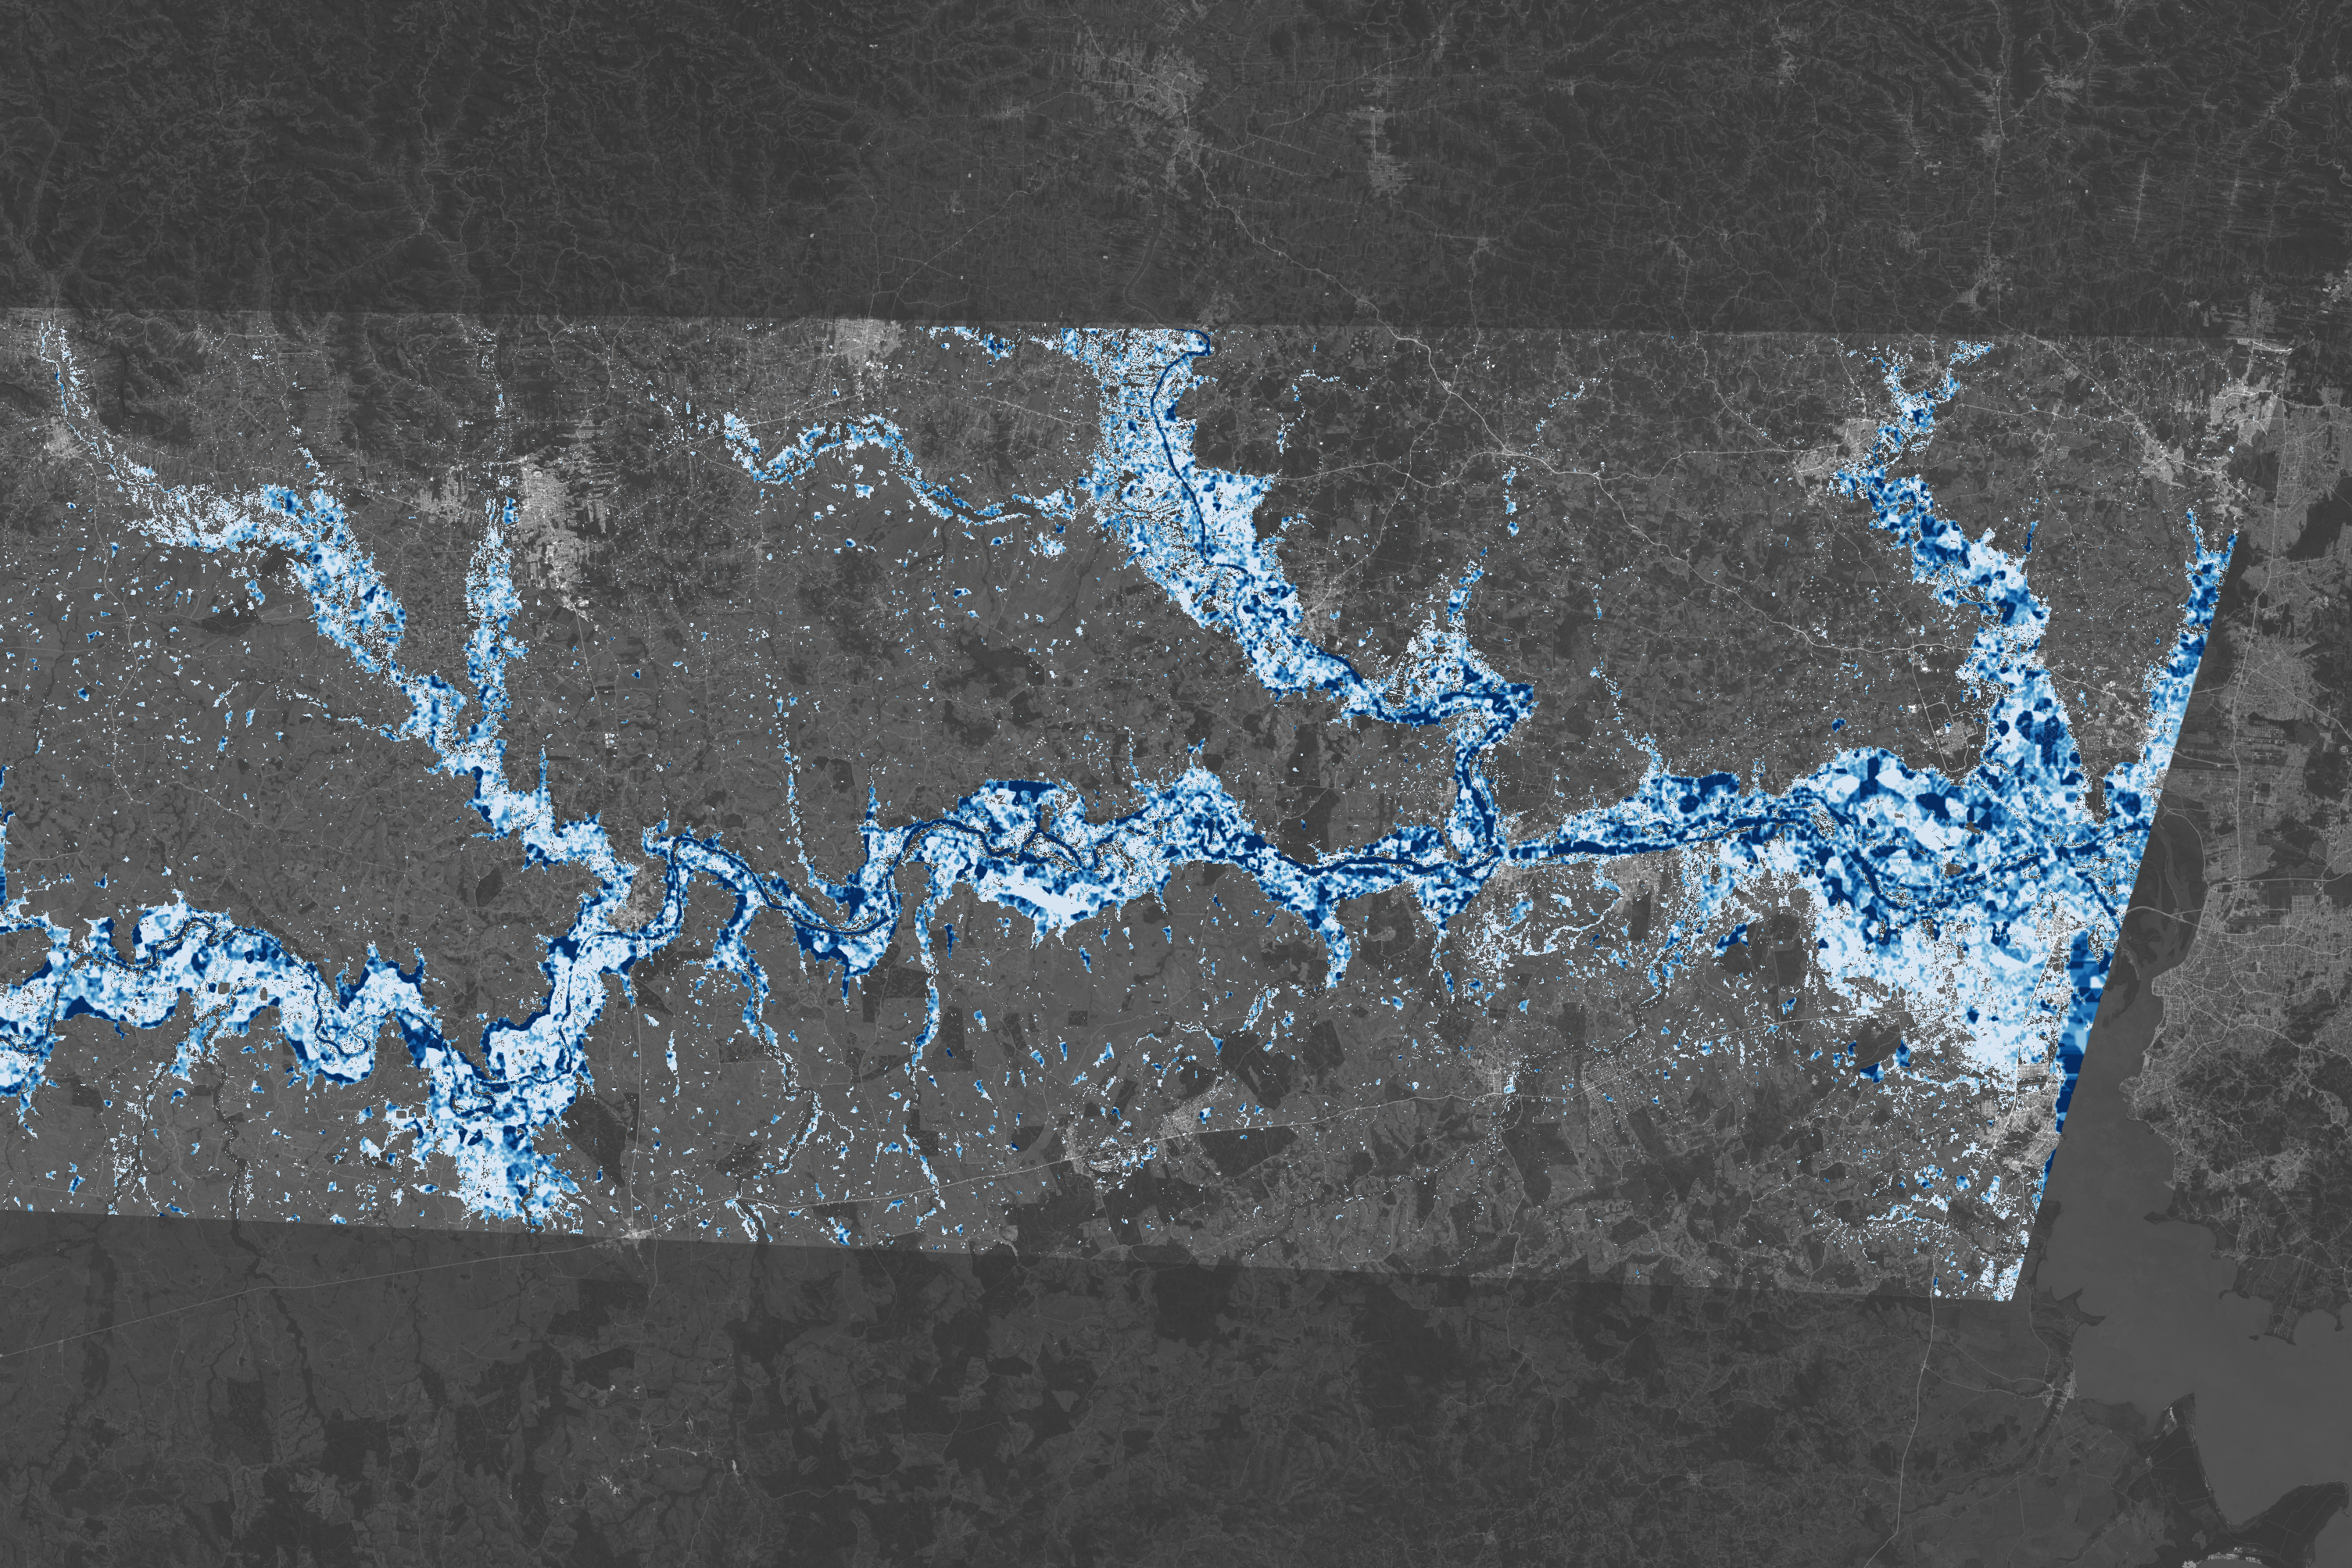
This map shows estimates of flood depth in areas west of Porto Alegre, the state’s capital city, on May 6, 2024. The darkest blue areas are where floodwater that day was at least 5 meters deep. But much of the inundated floodplain is light blue, which equates to depths of between 0.1 and 1 meter (4 and 40 inches).
“That’s still significant in terms of damage to housing and livelihoods of people,” said Dinuke Munasinghe, a researcher at NASA’s Jet Propulsion Laboratory (JPL) and member of the OPERA (Observational Products for End-Users from Remote Sensing Analysis) project science team. According to FEMA estimates, even 1 inch of floodwater can translate to tens of thousands of dollars (U.S.) in damages to a home.
Estimates for the map come from the Floodwater Depth Estimation Tool (FwDET). These estimates have provided critical information for past events, such as the widespread flooding that struck central Michigan in 2020. They have also been used operationally during past hurricane seasons. The tool relies on flood extent data and ground topography data to model the depth of floodwater.
The flood extent data for this map are from the OPERA Dynamic Surface Water Extent from Harmonized Landsat Sentinel-2 (OPERA DSWx-HLS) product, and ground topography data are from the Shuttle Radar Topography Mission (SRTM).
Floodwater maps for this event were made available on the open-access mapping portal of NASA’s Earth Applied Sciences Disasters program area, which was activated to support partners responding to the event.
NASA Earth Observatory floodwater depth map by Lauren Dauphin, using FwDET data processed and provided by Dinuke Munasinghe/NASA/JPL-Caltech. FwDET development led by Sagy Cohen/University of Alabama. Primary input for FwDET includes the ARIA/OPERA DSWx-HLS data product provided by Alexander Handwerger/NASA/JPL-Caltech. HLS Version-2.0, an input of DSWx-HLS, was developed at NASA GSFC. Story by Kathryn Hansen.