The Earth Observatory has published its last Image of the Day on this website. Please join us on our new home at science.nasa.gov/earth/earth-observatory.
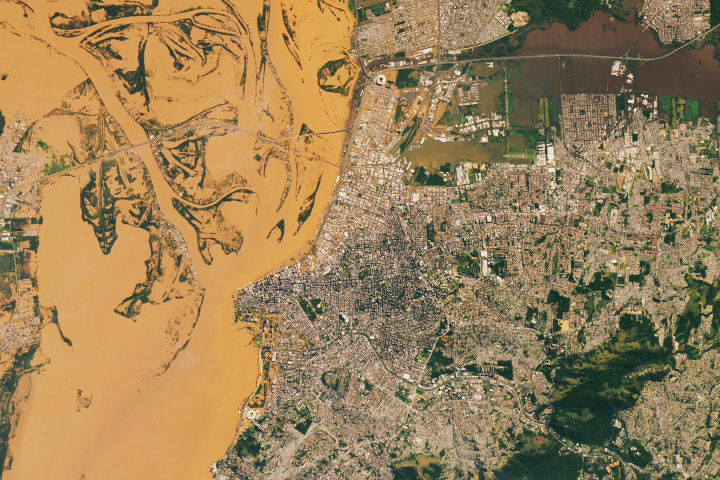
Strong storms bringing high winds and torrential rain began to sweep into Rio Grande do Sul, Brazil’s southernmost state, on April 27, 2024. In some areas, more than 300 millimeters (12 inches) of rain fell in less than a week, overtopping river banks and leading to widespread, destructive flooding.
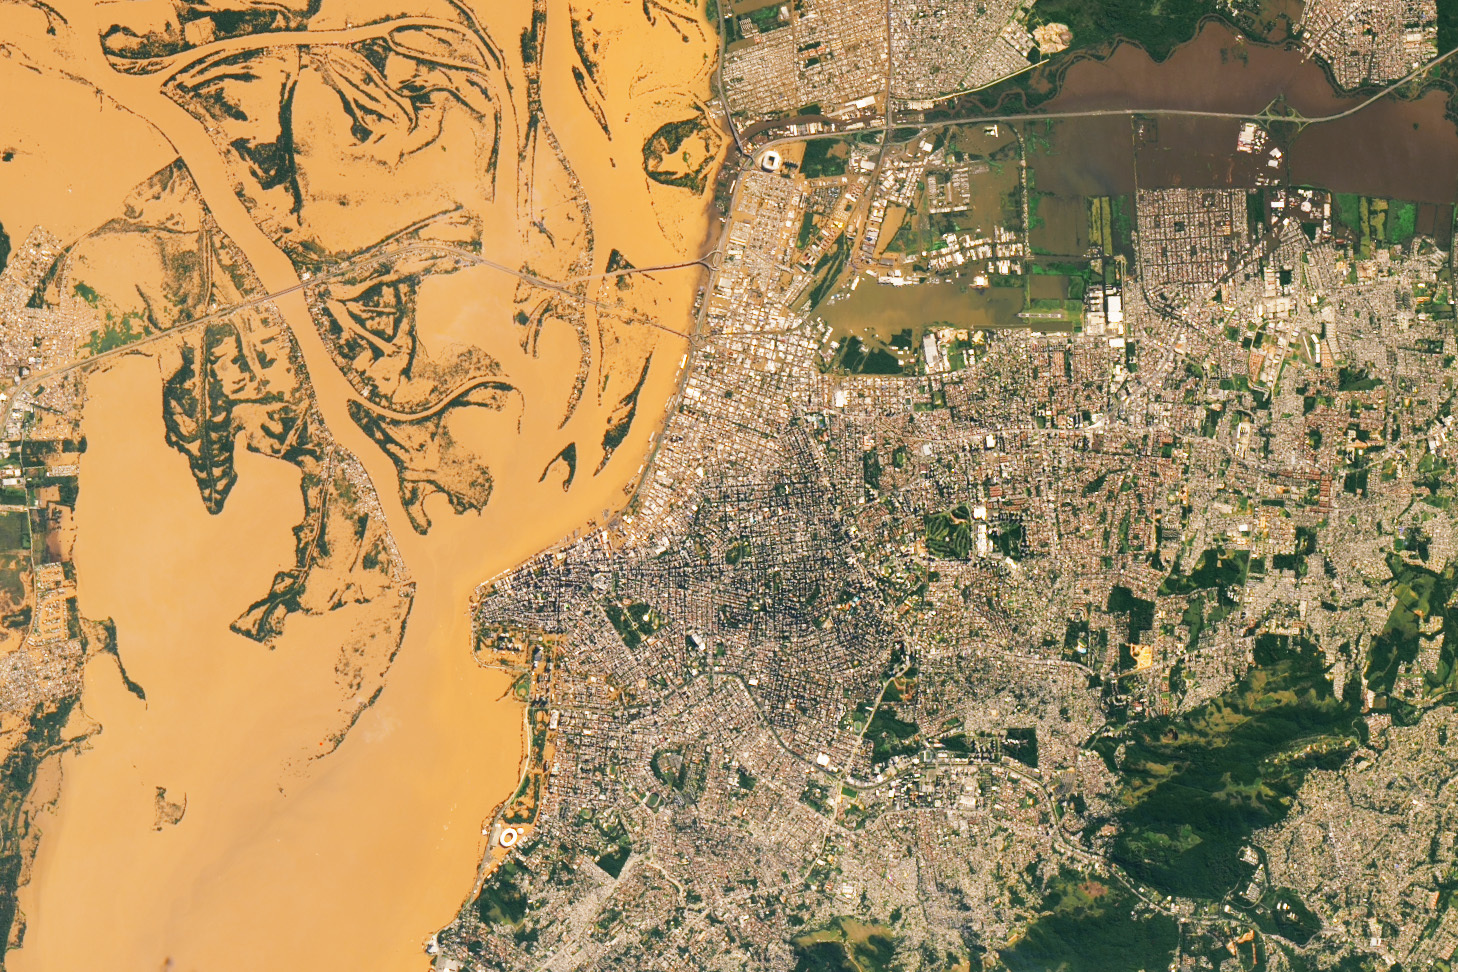
The OLI (Operational Land Imager) on Landsat 8 captured an image (above) of Porto Alegre’s flooded downtown area on May 8, 2024. Floodwater inundated the historic district, caused the international airport to close, swept through major stadiums, and left several highways impassable.
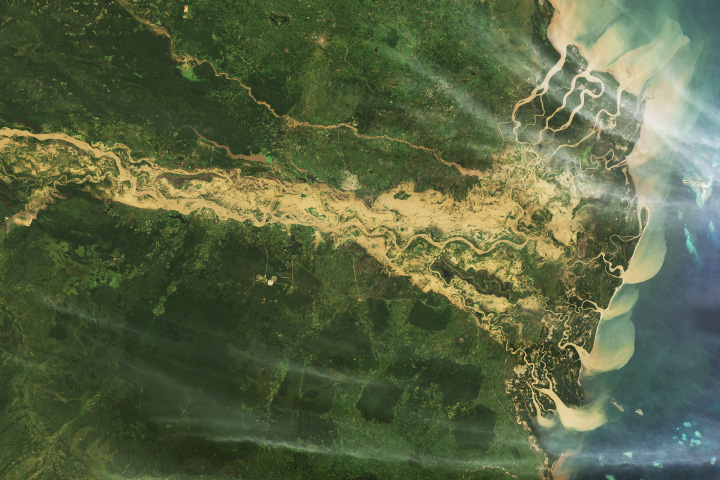
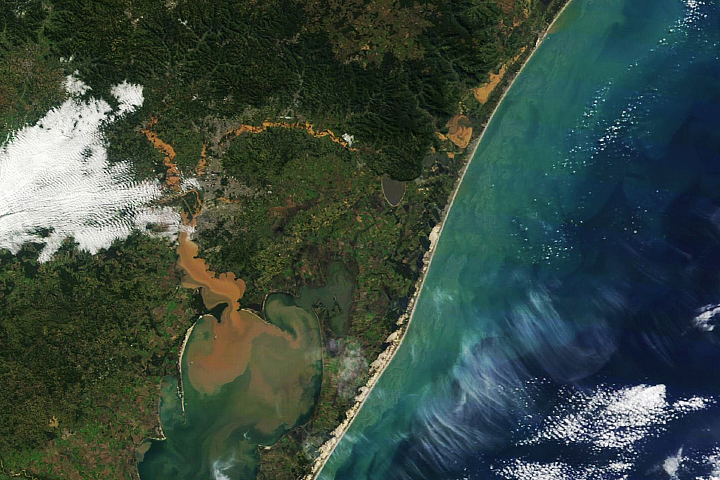
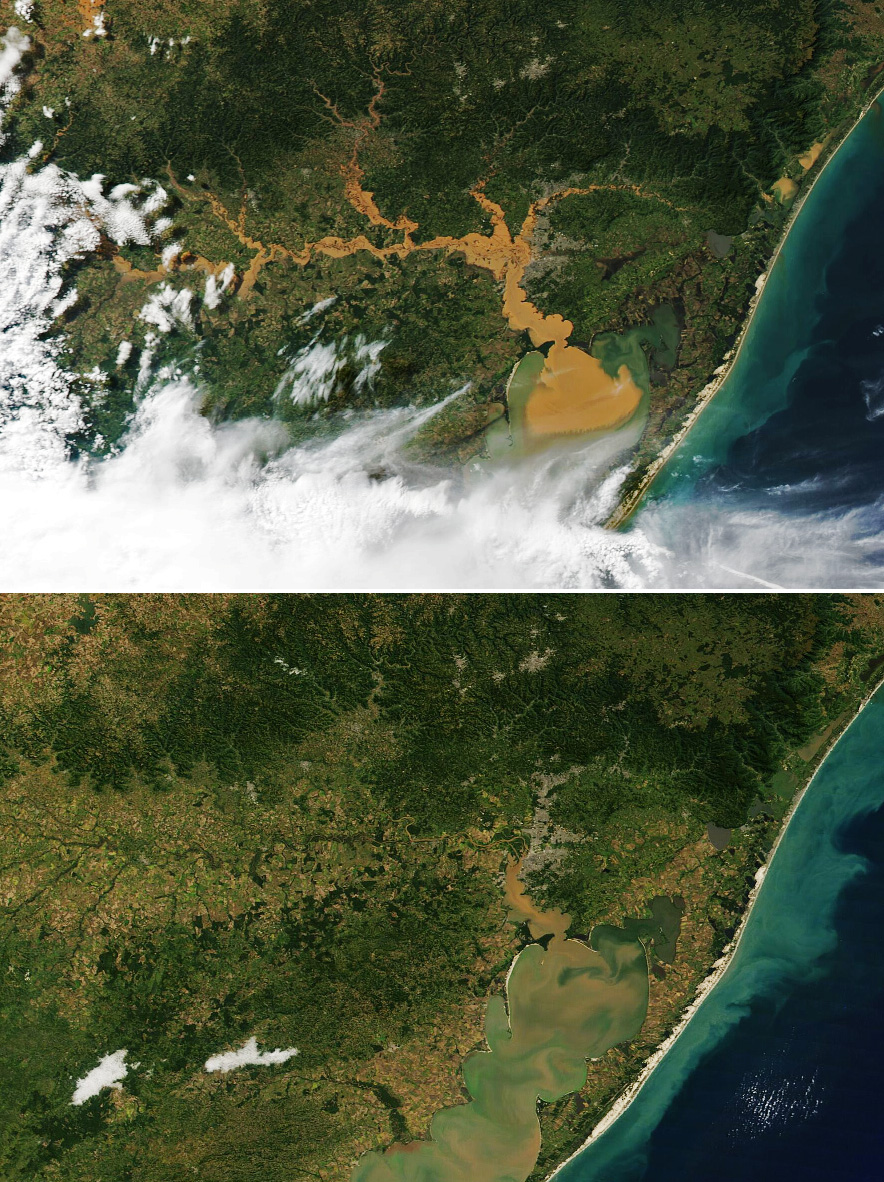
The MODIS (Moderate Resolution Imaging Spectroradiometer) on NASA’s Terra and Aqua satellites acquired these images (below) on May 6 and April 20, during and before the flooding. Water overtopped the banks of the Jacuí, Cai, and Sinos rivers, inundating parts of Porto Alegre, the state’s capital city. Floodwater also spilled into several other cities, towns, and farmland upriver. Runoff, stained brown with suspended sediment, is visible flowing into the Patos Lagoon, south of Porto Alegre.
The flooding caused havoc throughout Rio Grande do Sul state. More than 160,000 people have been displaced, and scores of people have died, according to Rio Grande do Sul’s agency for civil defense. The state is a major producer and exporter of soy, rice, wheat, and meat. Farmers are already reporting extensive damage in several areas, and analysts expect that damage to silos and other storage facilities, transportation networks, and ports will disrupt grain exports.
According to Brazil’s National Institute of Meteorology (INMET), the weakening El Niño contributed to the region’s extreme rains by helping steer cold fronts toward Rio Grande do Sul and concentrating atmospheric instability over the state. Unusually warm water in the South Atlantic Ocean boosted humidity levels, setting up a collision between warm, humid air from the Amazon and colder air to the south of the state that strengthened the storms, INMET said.
The extreme rainfall fits a broader pattern of change that climate scientists expect to see in this region due to the rising atmospheric concentrations of carbon dioxide and other greenhouse gases. This part of South America is projected to see significant increases in annual precipitation totals and annual 5-day precipitation maximums by 2050, according to the Sixth Assessment Report of the Intergovernmental Panel on Climate Change. The projections are based on simulations from the CMIP-6 (Coupled Model Intercomparison Project) multi-model ensemble, a project that incorporates modeling results from the GISS ModelE, a general circulation model developed by NASA’s Goddard Institute for Space Studies.
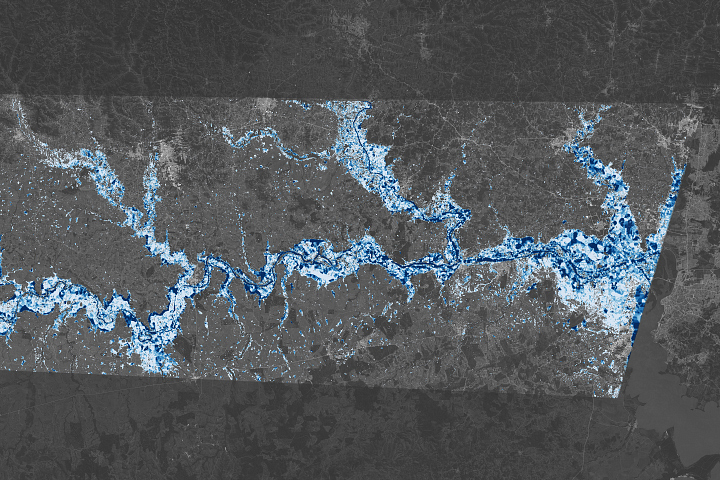
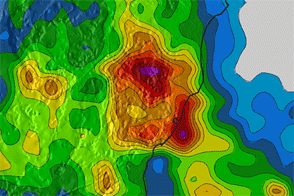
NASA’s Global Flood Product shows extensive flooding in Rio Grande do Sul, Brazil on May 6, after the devastating heavy rains in the region. The 1-day product is shown here, with #flooding in red, and normal surface water in blue.
— NASAEarthdata (@NASAEarthData) May 7, 2024
Learn about the data: https://t.co/68o31xTanL pic.twitter.com/IRwQwavbvI
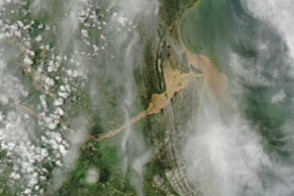
NASA’s Earth Applied Sciences Disasters program area has been activated to support partners responding to the event. The team is using satellite data to map landslides and identify regions without power. As new information becomes available, the team will be posting maps and data products on its open-access mapping portal. Among them is NASA’s MODIS Near Real-Time Global Flood product, which showed extensive flooding in and around the city on May 6, 2024 (above).
NASA Earth Observatory images by Wanmei Liang, using MODIS data from NASA EOSDIS LANCE and GIBS/Worldview and Landsat data from the U.S. Geological Survey. Story by Adam Voiland.