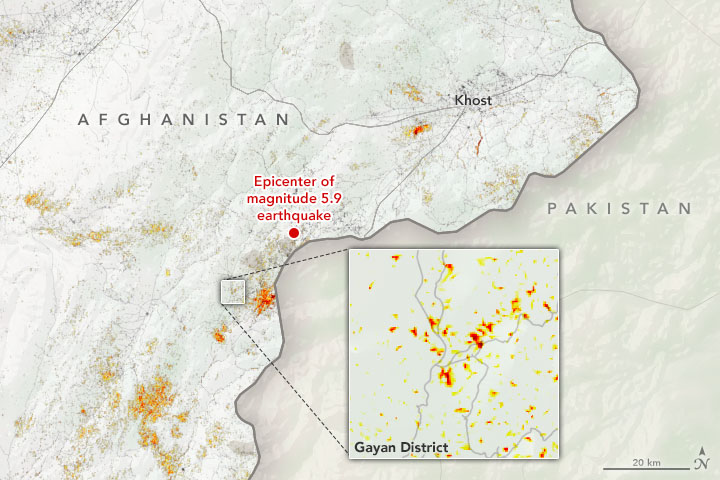
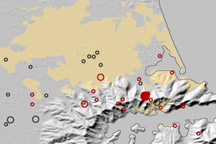
Early on June 22, 2022, a magnitude 5.9 earthquake struck eastern Afghanistan, devastating parts of the Khost and Paktika provinces.
The map above, based on a product developed by the Earth Observatory of Singapore Remote Sensing Lab (EOS-RS), depicts areas that were likely damaged. A gradient of color from yellow to red indicates increasingly more significant surface changes. Dark red pixels represent the most severe damage, while orange and yellow areas are moderately or partially damaged. Each colored pixel represents an area of 30 meters by 30 meters (about the size of a baseball infield).
One area that took severe damage was the Gayan District in Paktika. Roughly 1,000 of the district’s homes were destroyed, according to a report from the United Nations Office for the Coordination of Humanitarian Affairs.
More than 1,000 people were killed and several thousand injured throughout Afghanistan, according to reports from humanitarian aid organizations. The earthquake proved so deadly because it originated at a shallow depth and produced intense shaking in a populated area full of vulnerable buildings. It also struck in the middle of the night, when many people were at home.
The map was derived from synthetic aperture radar (SAR) images acquired by the Copernicus Sentinel-1 satellites operated by the European Space Agency (ESA) before (March 2 to June 18) and after (June 30) the event. It contains modified Copernicus Sentinel data, processed by ESA and analyzed by EOS-RS, using the Advanced Rapid Imaging and Analysis (ARIA) system originally developed at NASA’s Jet Propulsion Laboratory, California Institute of Technology, and modified at EOS-RS. The ARIA team is supported by NASA’s Earth Science Disasters Program.
“This map could be used as a guide to identify damaged areas, and may be less reliable over vegetated areas,” Earth Observatory of Singapore (EOS) noted. “Scattered pixels over vegetated areas may be false positives, and a lack of colored pixels over vegetated areas may not mean no damage.”
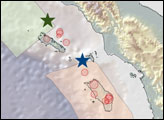
Earthquakes and active faults in this area are the result the shifting of tectonic plates. The Indian plate is moving northward at a rate of about 40 millimeters per year (1.6 inches per year) and colliding with the Eurasia plate, leading to regular seismic activity.
NASA Earth Observatory image by Joshua Stevens, using modified Copernicus Sentinel data (2022) processed by ESA and analyzed by the Earth Observatory of Singapore (EOS) in collaboration with NASA-JPL and Caltech. Story by Adam Voiland.


