Editor’s note: This article is the second in a series on how trends in air pollution affect burdens of disease in urban areas. Read part 1 at: No Breathing Easy for City Dwellers: Nitrogen Dioxide.
Air pollution is the fourth leading risk factor for death around the world. But one type of pollutant is particularly harmful: fine particulate matter (PM2.5). These small, inhalable particles (less than 2.5 micrometers in diameter) result from direct emissions into the air, as well as interactions among other pollutants. PM2.5 is the leading cause of death among air pollutants, contributing to cardiovascular and respiratory disease and millions of premature deaths worldwide each year.
In a new study covering urban settlements worldwide, researchers found that PM2.5 concentrations and associated mortality declined in some areas due to reductions in precursor pollutants (such as oxides of sulfur and nitrogen) after the passage of clean air laws. However, the global average mortality rate attributable to PM2.5 remained relatively stable from 2000 to 2019.
“That’s the global average,” said Susan C. Anenberg, an associate professor of global health at the George Washington University, “and that really masks very different dynamics happening depending on where you are in the world.”
The study by Anenberg and colleagues is one of a pair of NASA-funded studies, published in The Lancet Planetary Health in January 2022, that provide estimates of the burden of disease from air pollution in more than 13,000 urban areas around the world. The first study focused on nitrogen dioxide (NO2), which is a precursor to PM2.5. In both studies, the teams combined two decades of satellite observations with health data from the Global Burden of Disease study, a comprehensive study on health, risk factors, disease, and death in 204 countries since 1990.
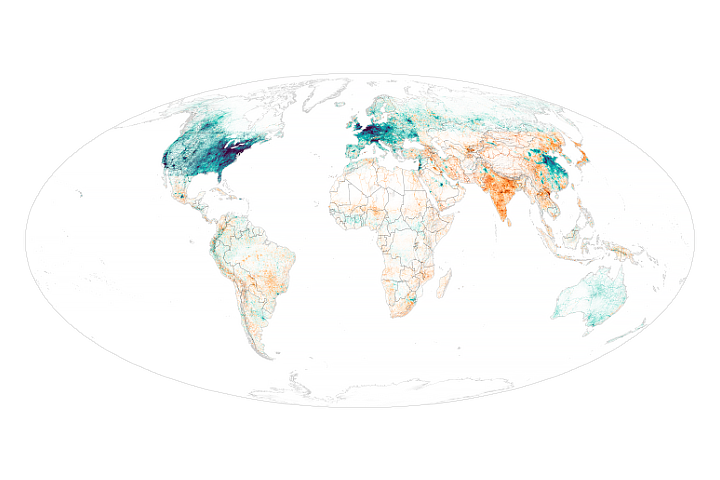
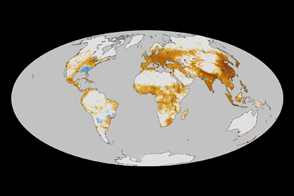
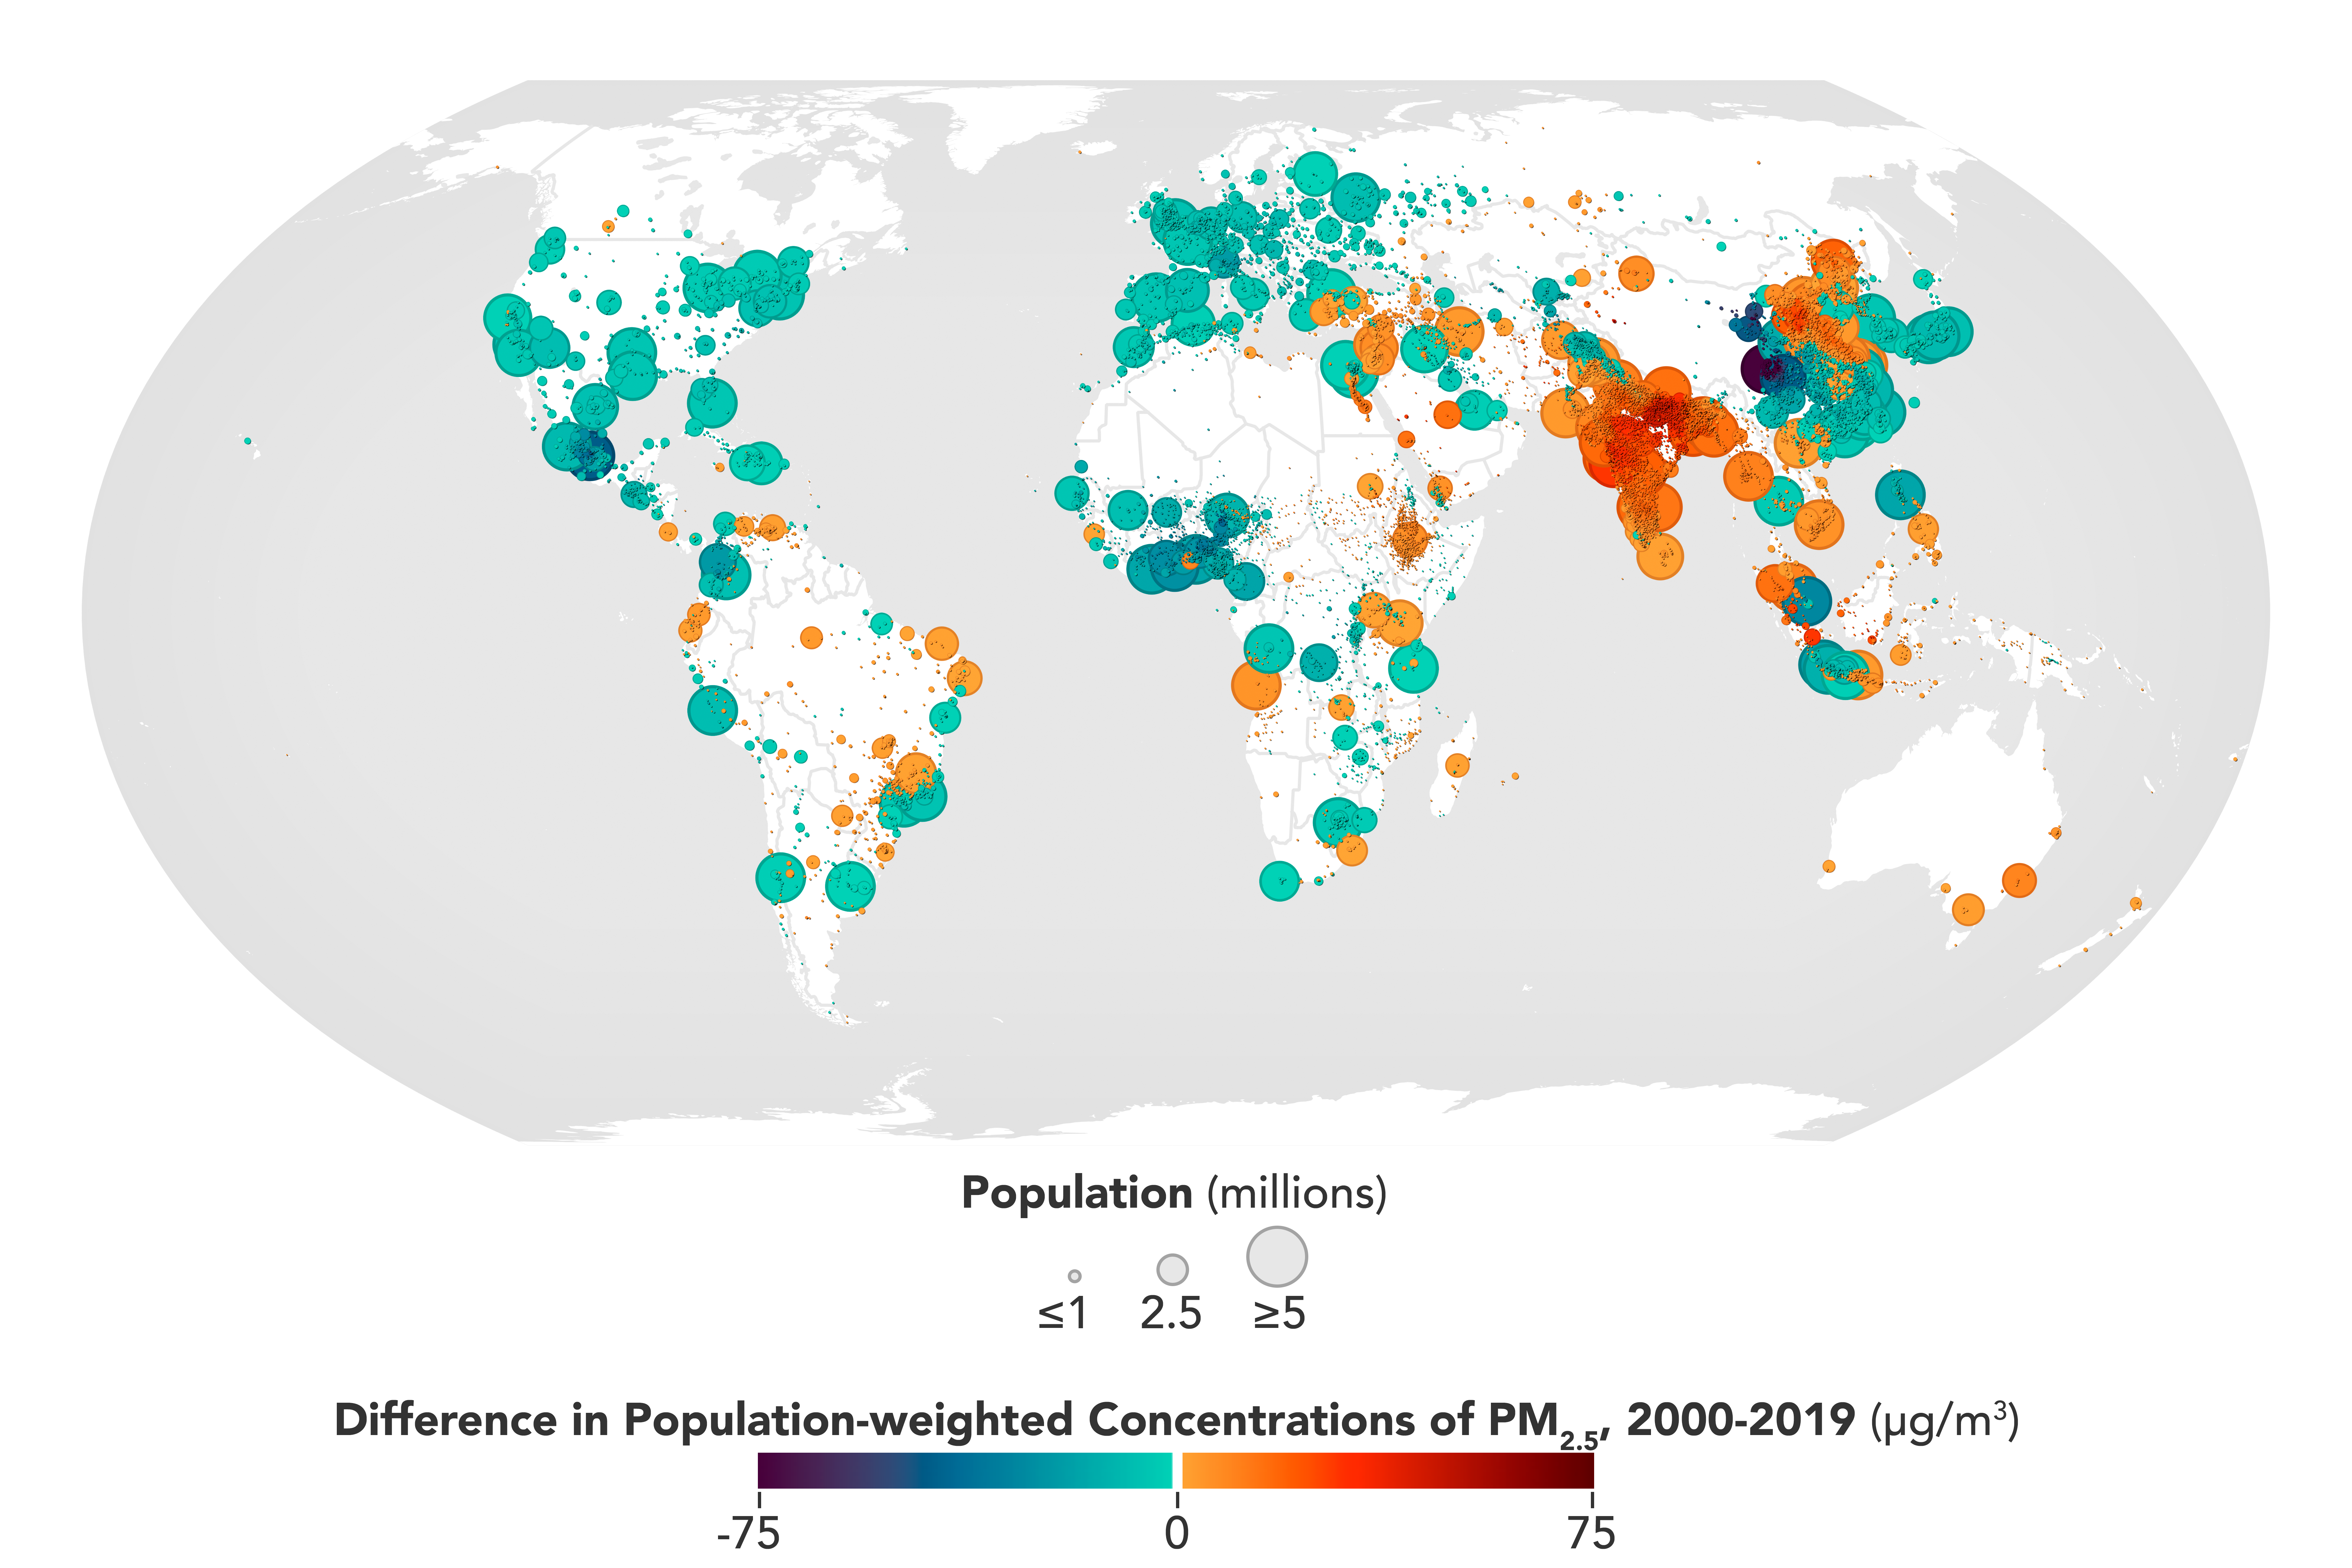
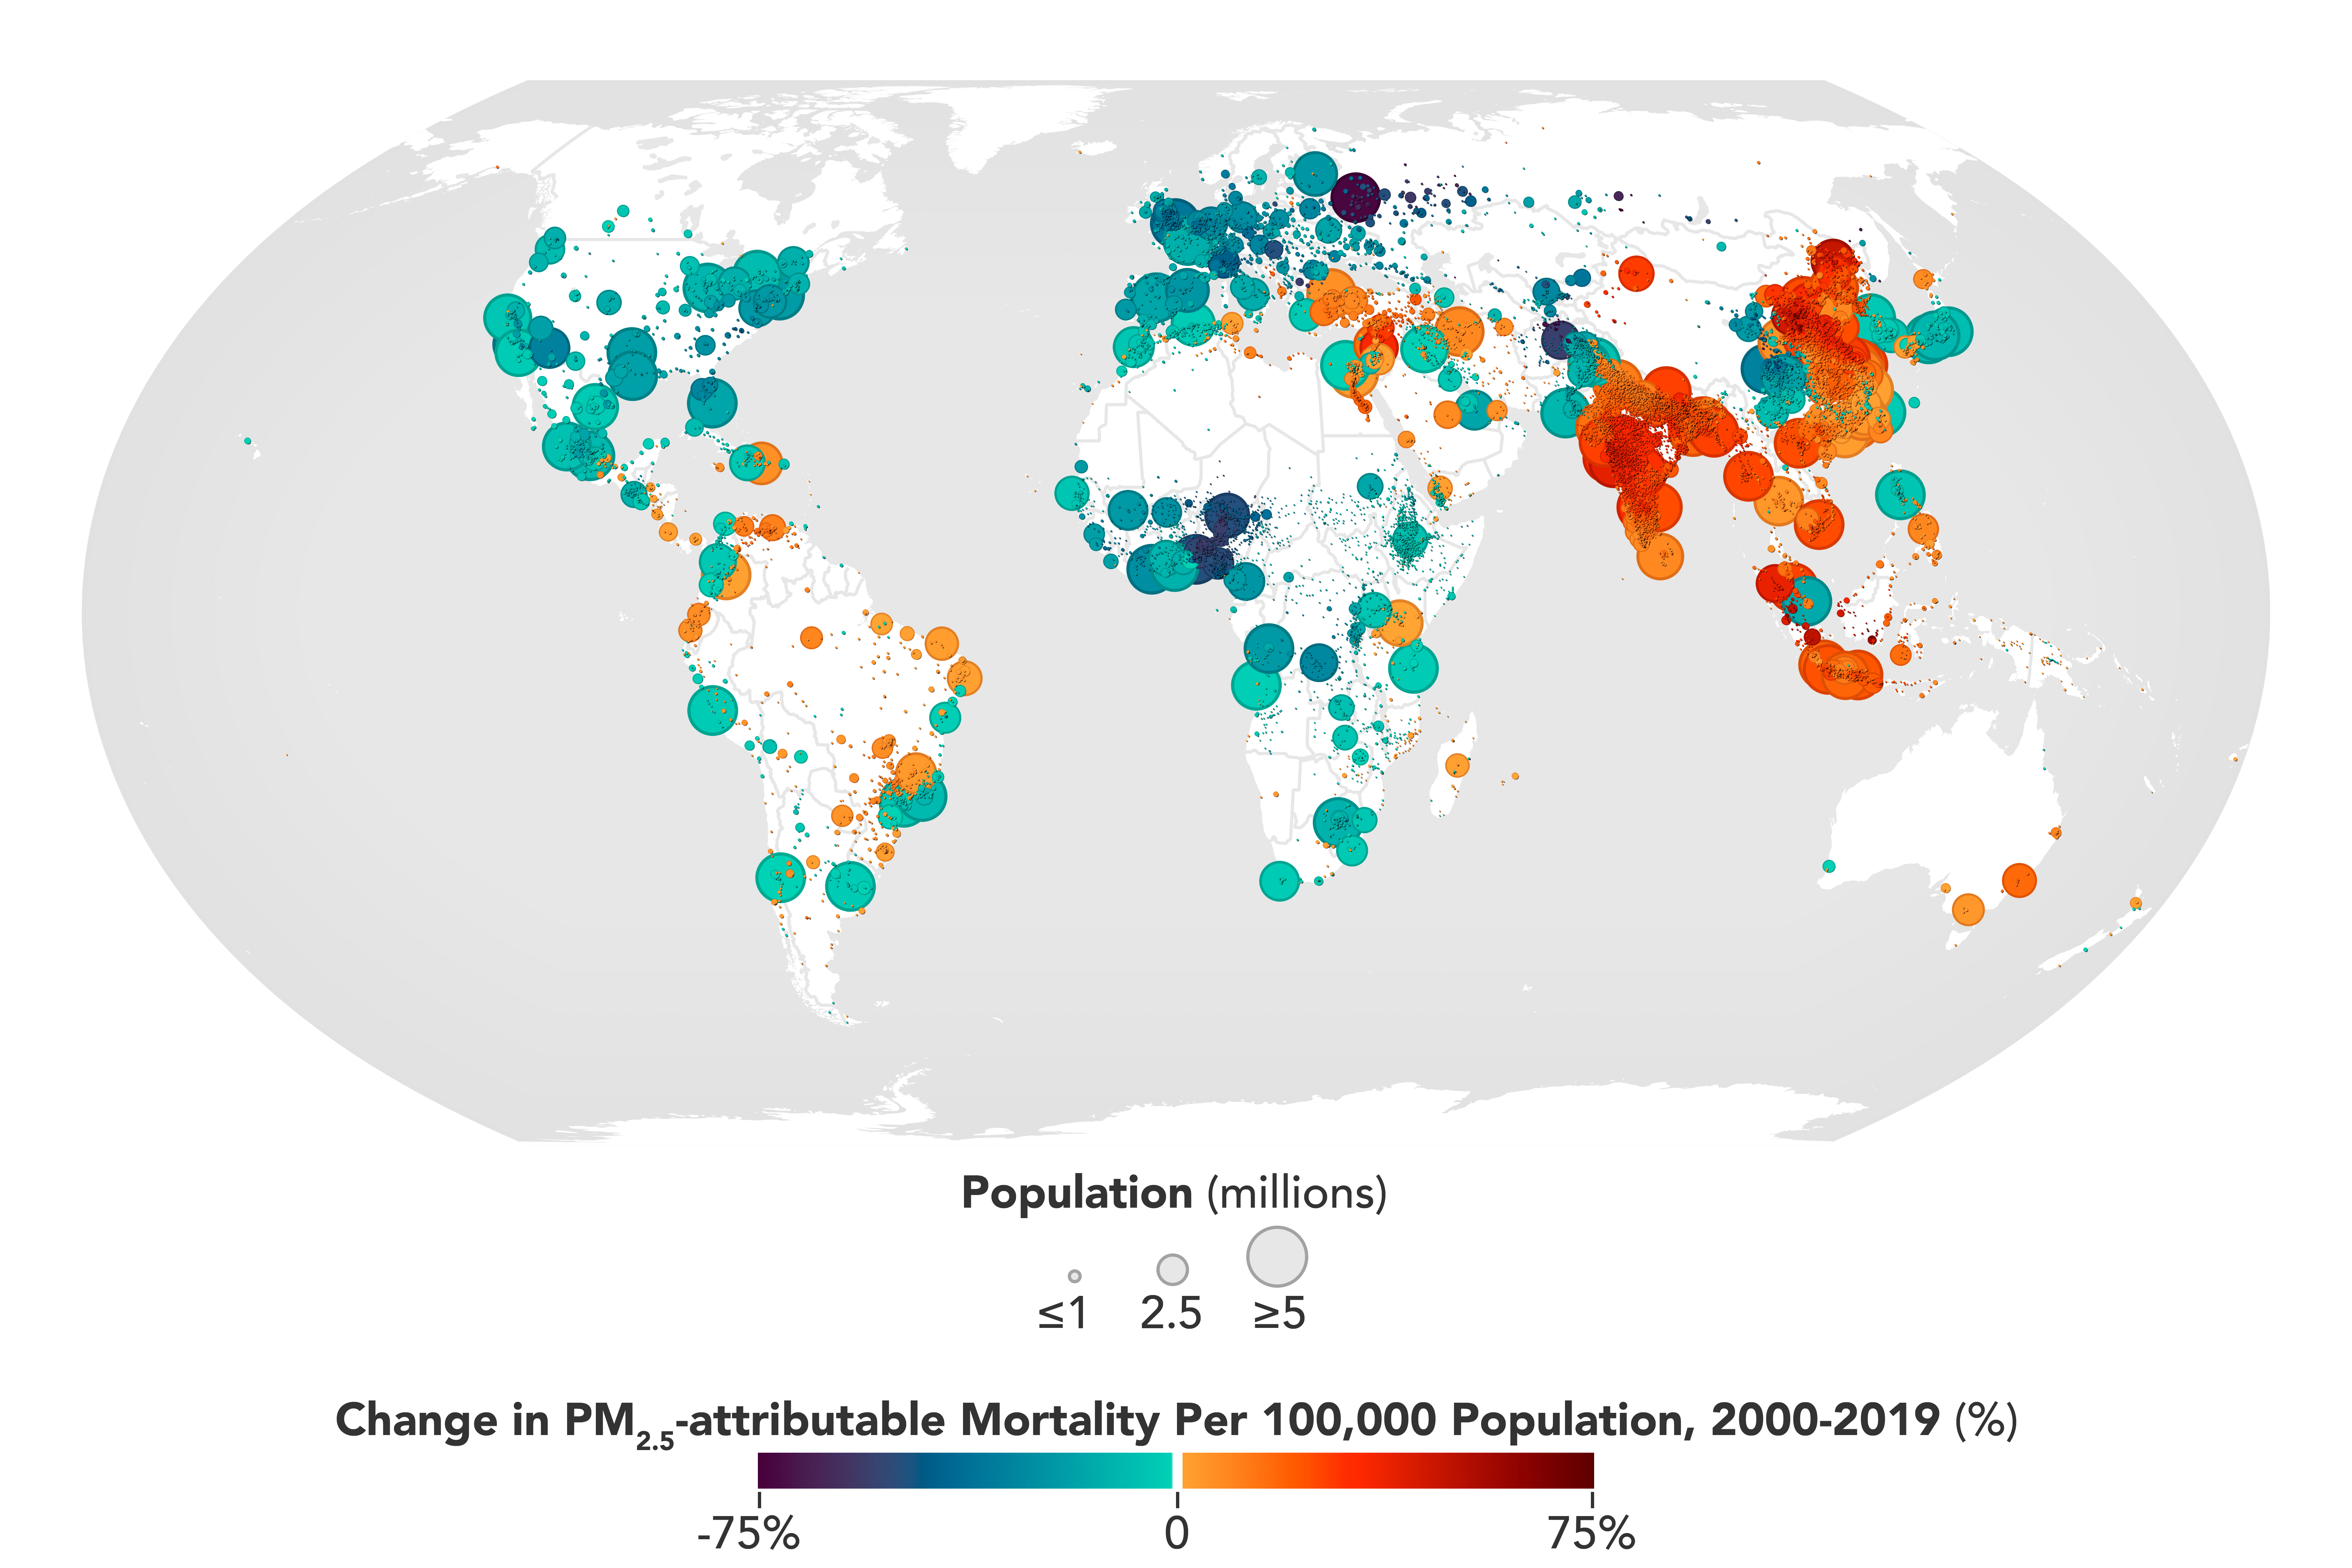
The maps above show the changes in PM2.5 concentrations and mortality for urban areas around the world between 2000 and 2019. The first map shows absolute change in PM2.5 concentrations weighted by population. The second map shows the percentage change in PM2.5-attributable mortality rates per 100,000 population. Cities in Southeast Asia saw some of the largest annual average increases in both metrics.
The map synthesizes measurements of aerosol optical depth acquired by NASA’s Moderate Resolution Imaging Spectroradiometer (MODIS), Multi-angle Imaging SpectroRadiometer (MISR) and Sea-viewing Wide Field-of-view Sensor (SeaWiFS)—satellite instruments flying since the late 1990s.
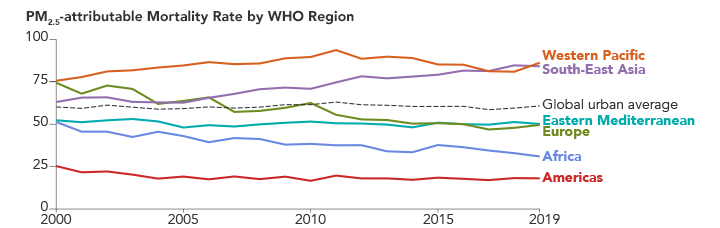
The graph above shows the global and regional urban averages of PM2.5-attributable mortality rates in different regions between 2000 and 2019. The dashed line shows the relatively steady global average rate.
“There is a large range in the average PM2.5 concentration and associated health risk for urban areas in different world regions,” Anenberg said. “Urban PM2.5 and associated health impacts are improving in Europe and in the Americas, and worsening in South Asia. In the Western Pacific, which is the region that included China, urban air pollution and associated health impacts increased dramatically before declining more recently.”
In some cities, even though the PM2.5 concentrations declined, the PM2.5-attributable mortality increased. This was due to aging populations and to disease rates shifting over time. “You have to think about not just the concentrations,” Anenberg said, “but the vulnerability of the people who are breathing that air.”
In 2019, about 86 percent of city dwellers worldwide (2.5 billion people) were found to live in areas where PM2.5 concentrations exceeded World Health Organization guidelines. Those levels of PM2.5 pollution resulted in an excess of 1.8 million deaths that year, the researchers found.
“Nearly everyone in any city around the world is exposed to air that has harmful levels of air pollution in it,” said Anenberg, a member of NASA’s Health and Air Quality Applied Sciences team.
For areas with little to no ground-based pollution monitoring, the data from Anenberg and colleagues may be the first that local officials have regarding the impacts of air pollution in their cities. The team plans to continue working with local stakeholders and governments to help them interpret the data.
“Even cities with ground monitors can benefit from this information because the monitors can be sparsely located and may not cover the entire urban area,” Anenberg said. The team next plans to apply their methodology and satellite data to examine trends over time for other pollutants, including ozone.
NASA Earth Observatory images by Joshua Stevens, using data courtesy of Southerland, V. A., et al. (2022). Story by Sara E. Pratt.