In a study published in August 2021, scientists found that the proportion of the world’s population exposed to floods grew by 20 to 24 percent. Although researchers expected an increase in the number of people living in flood-prone areas, the new estimates were ten times greater than what previous models predicted.
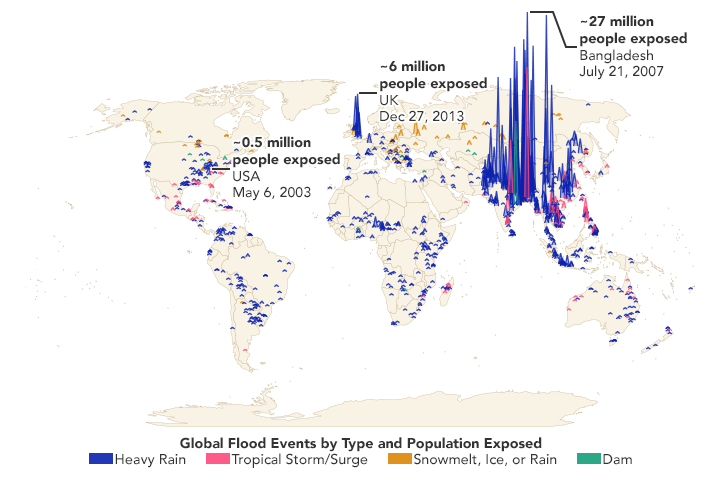
Reviewing 20 years of NASA satellite data, researchers mapped 913 large flood events across 169 countries and compared them with global population data to better understand the impact on people. The team found that from 2000–2015 between 58 and 86 million more people could be found living in floodplains around the world. More than 255 million people were affected at least once by major floods in that period. The increase in exposure includes new human developments and migration, but also the reclassification of some lands in the wake of large flood events and sea level rise. The types of flood events and number of people affected are represented in the map above.
“We need to understand why people are moving into floodplains and what ways we can support flood mitigation,” said lead author Beth Tellman, a geography researcher at the University of Arizona. “I think satellite and Earth observations can be transformative in how we think about building resilience in a world marked by climate change.”
The research, published in Nature and funded in part by NASA and Google Earth Outreach, relied on direct satellite observations from the Moderate-resolution Imaging Spectrometer (MODIS) instruments aboard NASA’s Terra and Aqua satellites. Building off of previous mapping efforts, members of the team built a new Global Flood Database, the world’s largest open library of flood maps. Tellman’s team included researchers from Cloud to Street, NASA, the University of Colorado, the University of Arizona, Columbia University, the University of Washington, the University of Texas, and the University of Michigan.
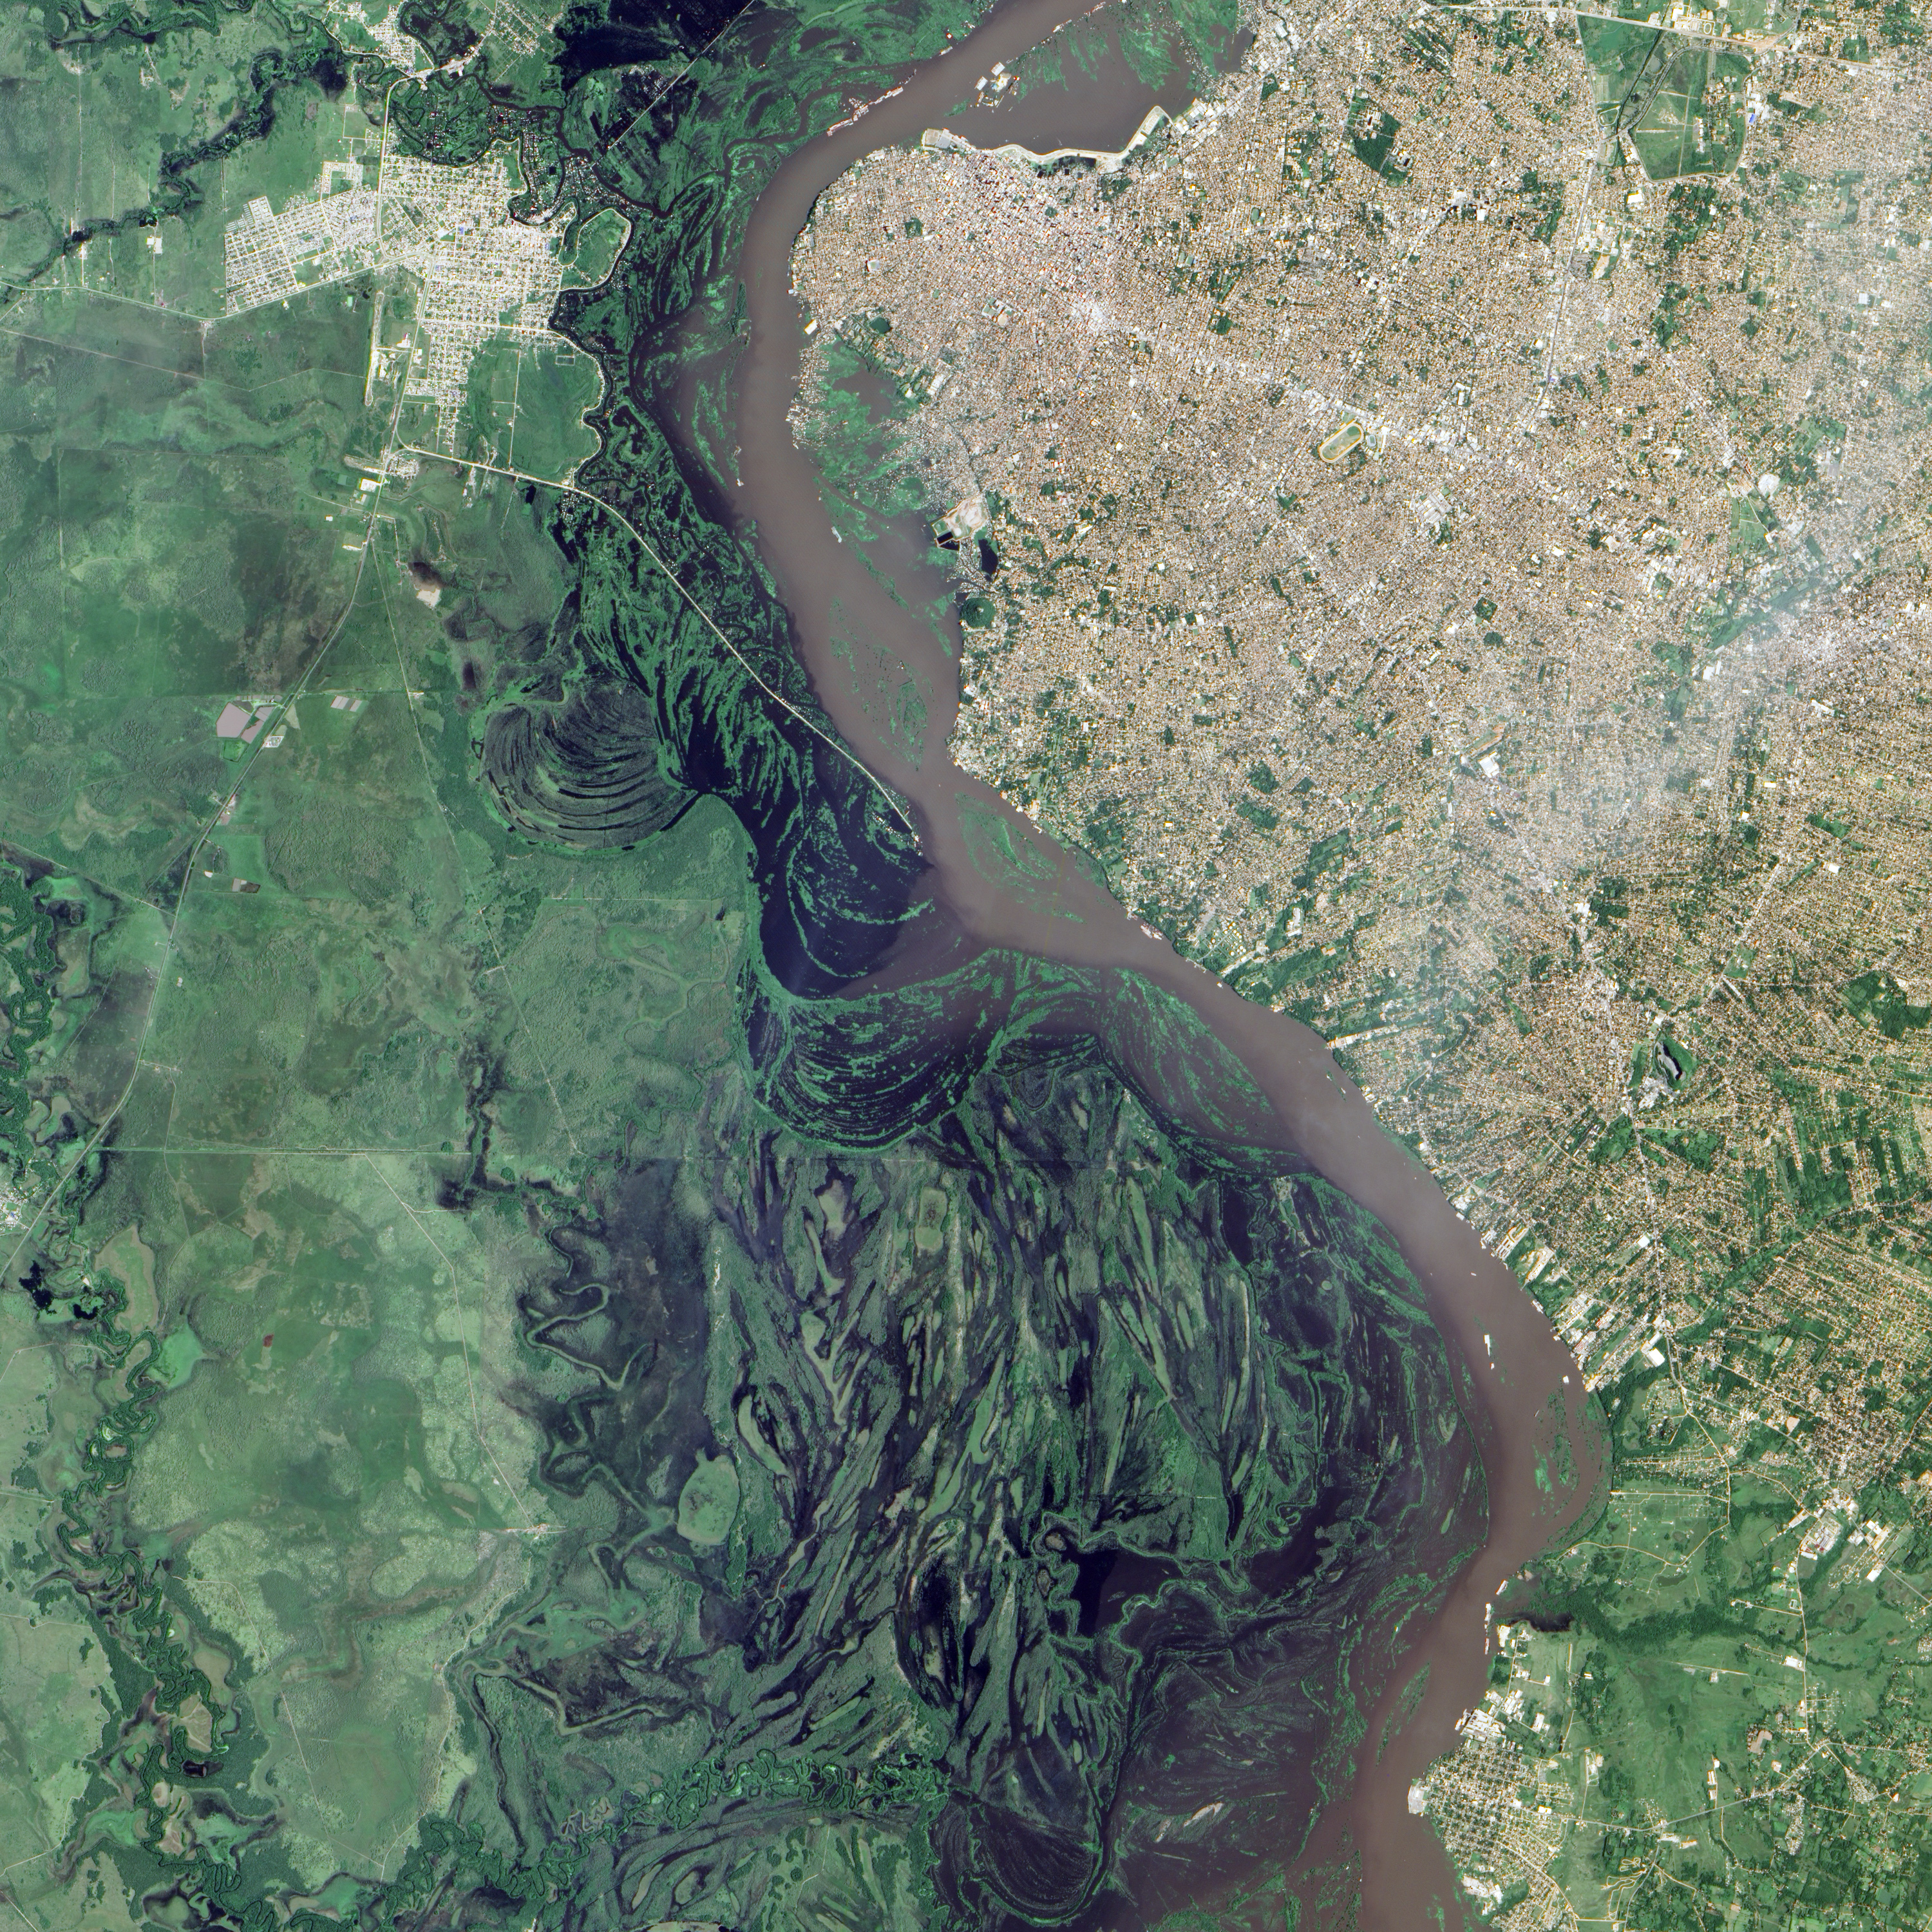
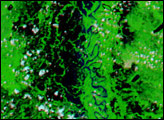
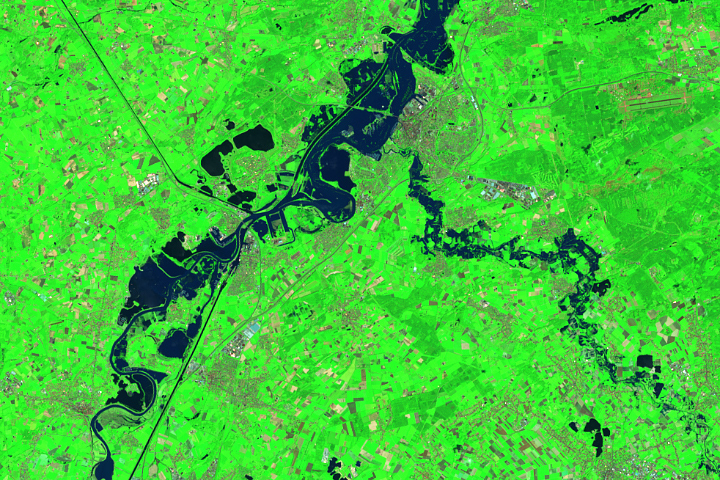
Although the scientists did not study why people are moving into flood-prone regions (such as the Rio Paraguay basin, above), Tellman said the cost of living and quality of infrastructure influence who and how safely people live in flood plains. “The people moving into floodplains are probably the most vulnerable, marginalized populations, and they may not have much of an option to move anywhere else,” she said. “Some use the term “blue-lining,” which refers to the way neighborhoods with racist housing policies toward communities of color (’redlining’) often have much higher flood risk. Redlining has led to historic underinvestment in flood mitigation infrastructure and in increased risk.”
According to the study, the proportion of people exposed to floods increased in 70 countries across all continents. Increased flood exposure was concentrated in middle- and low-income countries, with many of the countries located in Asia and Sub-Saharan Africa. At least 213 million people were shown to be exposed to flooding in South and Southeast Asia alone.
In the United States, North Carolina saw a 25 percent increase in population exposed to flooding—a change influenced by severe floods that displaced 1.5 million people after hurricanes Florence and Michael in 2018. New Orleans was one of the few areas that saw a decrease in exposure to flooding, which can likely be attributed to mitigation projects built after major flooding from Hurricane Katrina in 2005.
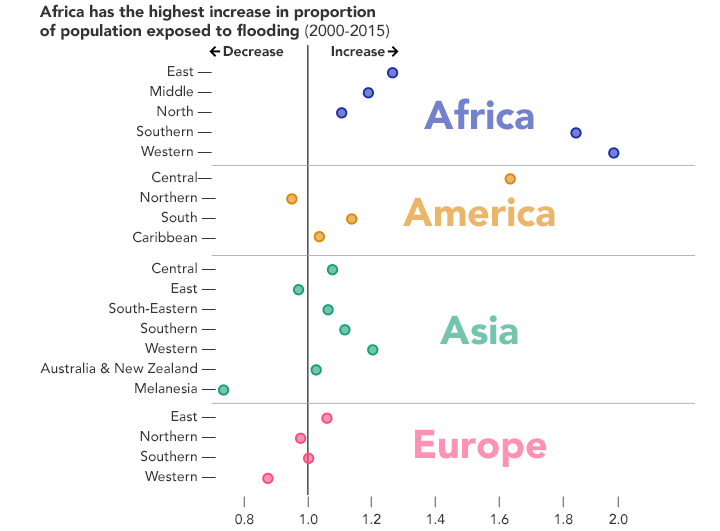
“Population is increasing at a higher rate in areas that we know have flooded in the recent past,” said Jonathan Sullivan, a postdoctoral scientist at the University of Arizona. “This element of exposure is being driven, in part, by how we decide where to develop.” The plot below breaks down by continent where populations increased or decreased within flood zones across the study period.
According to Sullivan, satellite observations can improve global flood models by estimating the impacts of flood risk on population and by accounting for dam breaks and snowmelt that have not always been taken into account in past models. “The way we typically think about flooding is from a risk perspective, but satellite imagery can help us understand things like the impact on households, income, wealth, and human health after a flood,” Sullivan added. “Once we have observed and know that it is flooding in a place, we can ask: what are the material impacts on people’s livelihoods?“
The dataset created by the research team can help with both retrospective analysis and future planning. “A unique and important result of this work is the historical record now available in Cloud to Street’s Global Flood Database,” said co-author Dan Slayback, a remote sensing scientist at NASA’s Goddard Space Flight Center. “At NASA, we have been generating a near real-time flood product for about a decade, but were not yet able to reprocess the full historical archive back to 2000. This project provides tremendous added value by giving us a longer historical context, which can then be compared to newly detected floods.”
Officials at every level of government can use tools like the Global Flood Database and NASA’s new sea level projection tool to assess the impacts of floods on local communities and plan for future flood events. Using such tools, city planners and government agencies can determine the best action to protect against future flooding.
Map and chart imagery created by Benjamin Cooley, Cloud to Street, and provided courtesy of Tellman, B., et al. (2021). NASA Earth Observatory image by Jesse Allen, using EO-1 ALI data provided courtesy of the NASA EO-1 team. Story by Emily Fischer, NASA Earth Science News Team, with Michael Carlowicz.