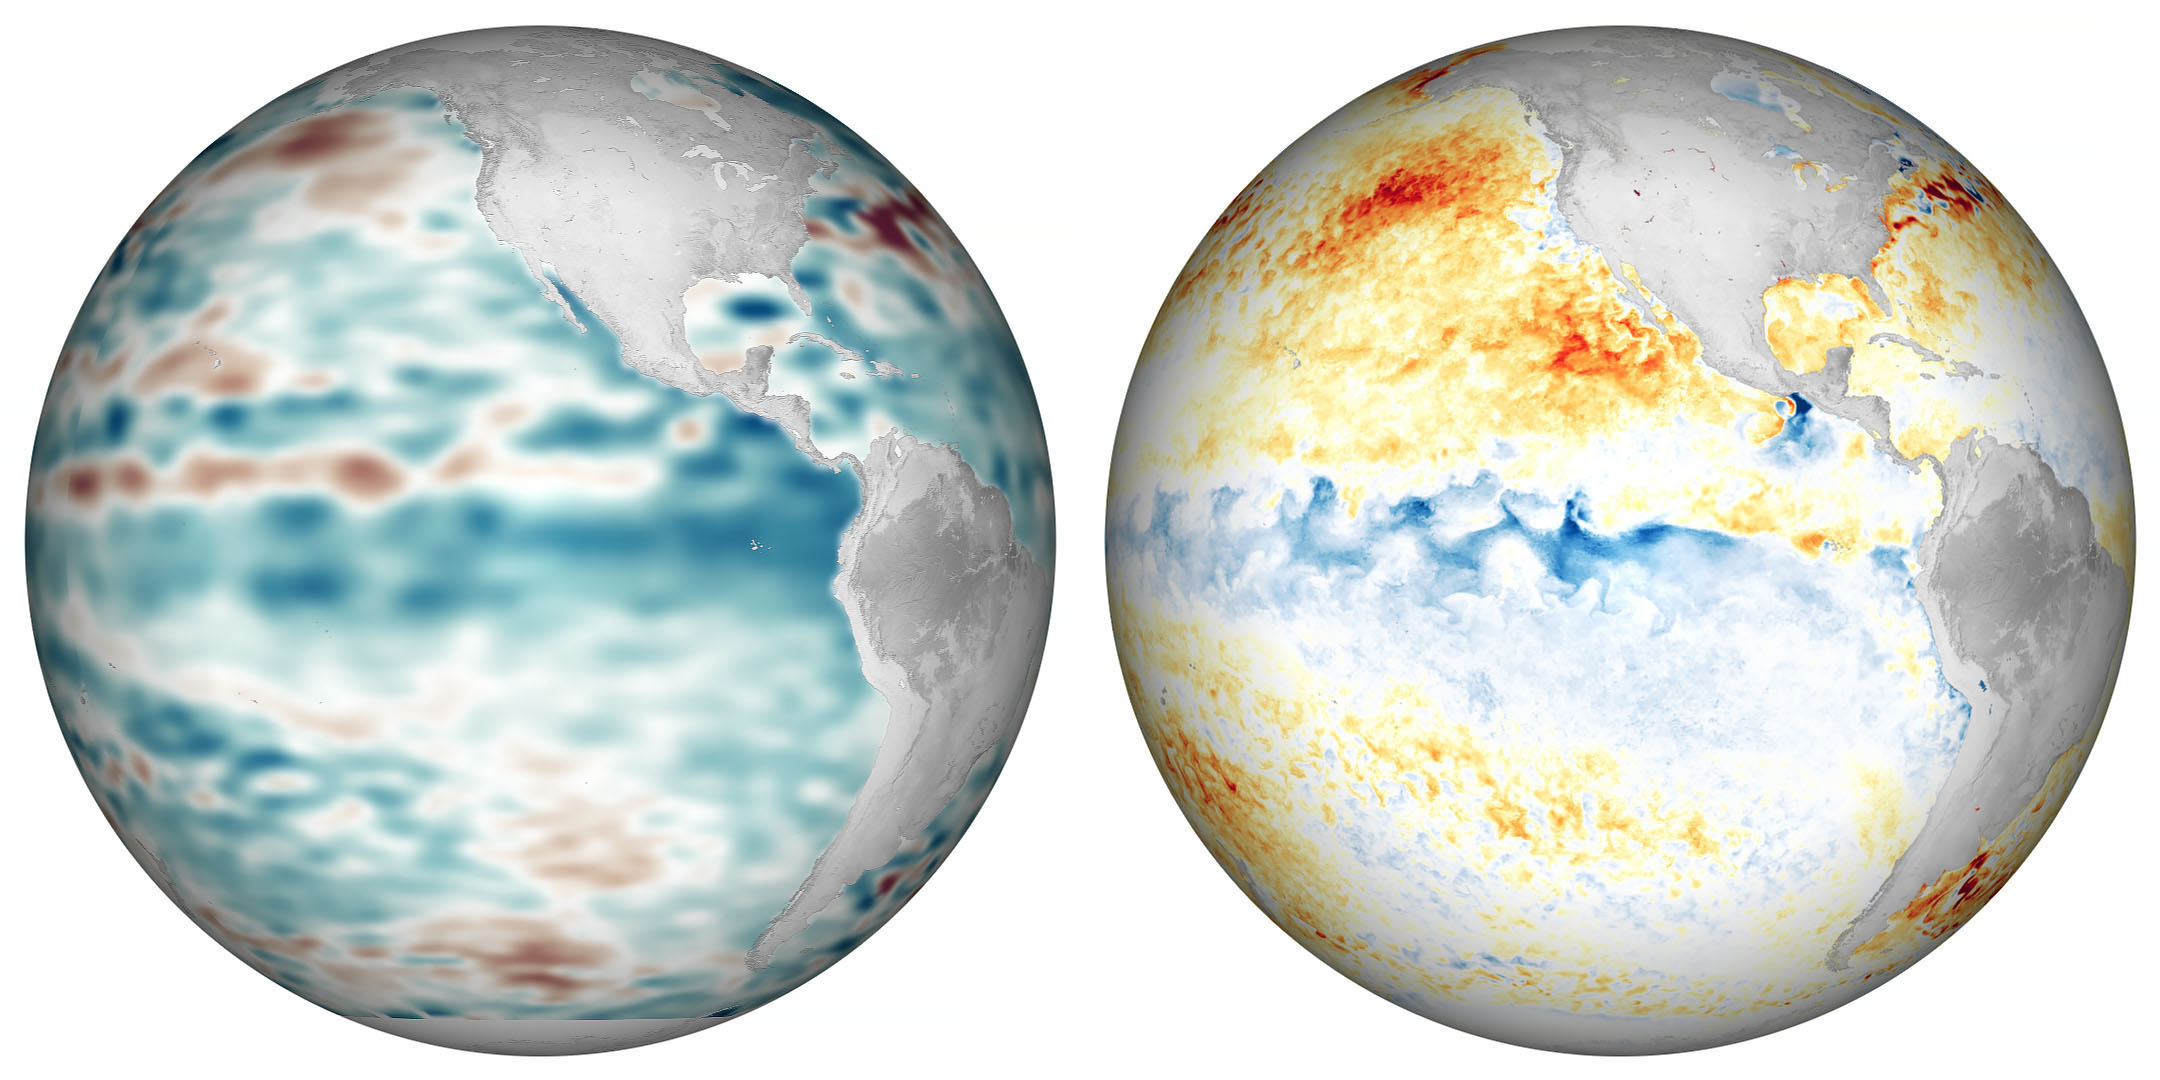
Though air and sea temperatures worldwide have been quite warm in 2020, the eastern and central Pacific Ocean recently grew milder with the return of La Niña, the cooler sister to El Niño. La Niña brings cool water up from the depths of the eastern tropical Pacific, a pattern that energizes easterly trade winds and pushes warm surface waters back toward Asia and Australia. With this see-sawing of the heat and moisture supply across the Pacific, global atmospheric circulation and jet streams shift.
During La Niña events, weather patterns typically grow warmer and drier across the southern United States and northern Mexico, noted Josh Willis, a climate scientist and oceanographer at NASA’s Jet Propulsion Laboratory (JPL). Cooler and stormier conditions often set in across the Pacific Northwest of Canada and the U.S. Clouds and rainfall become more sporadic over the central and eastern Pacific Ocean, which can lead to dry conditions in Brazil, Argentina, and other parts of South America. In the western Pacific, rainfall can increase dramatically over Indonesia and Australia. La Niña also can coincide with active Atlantic hurricane seasons, as it did this year.
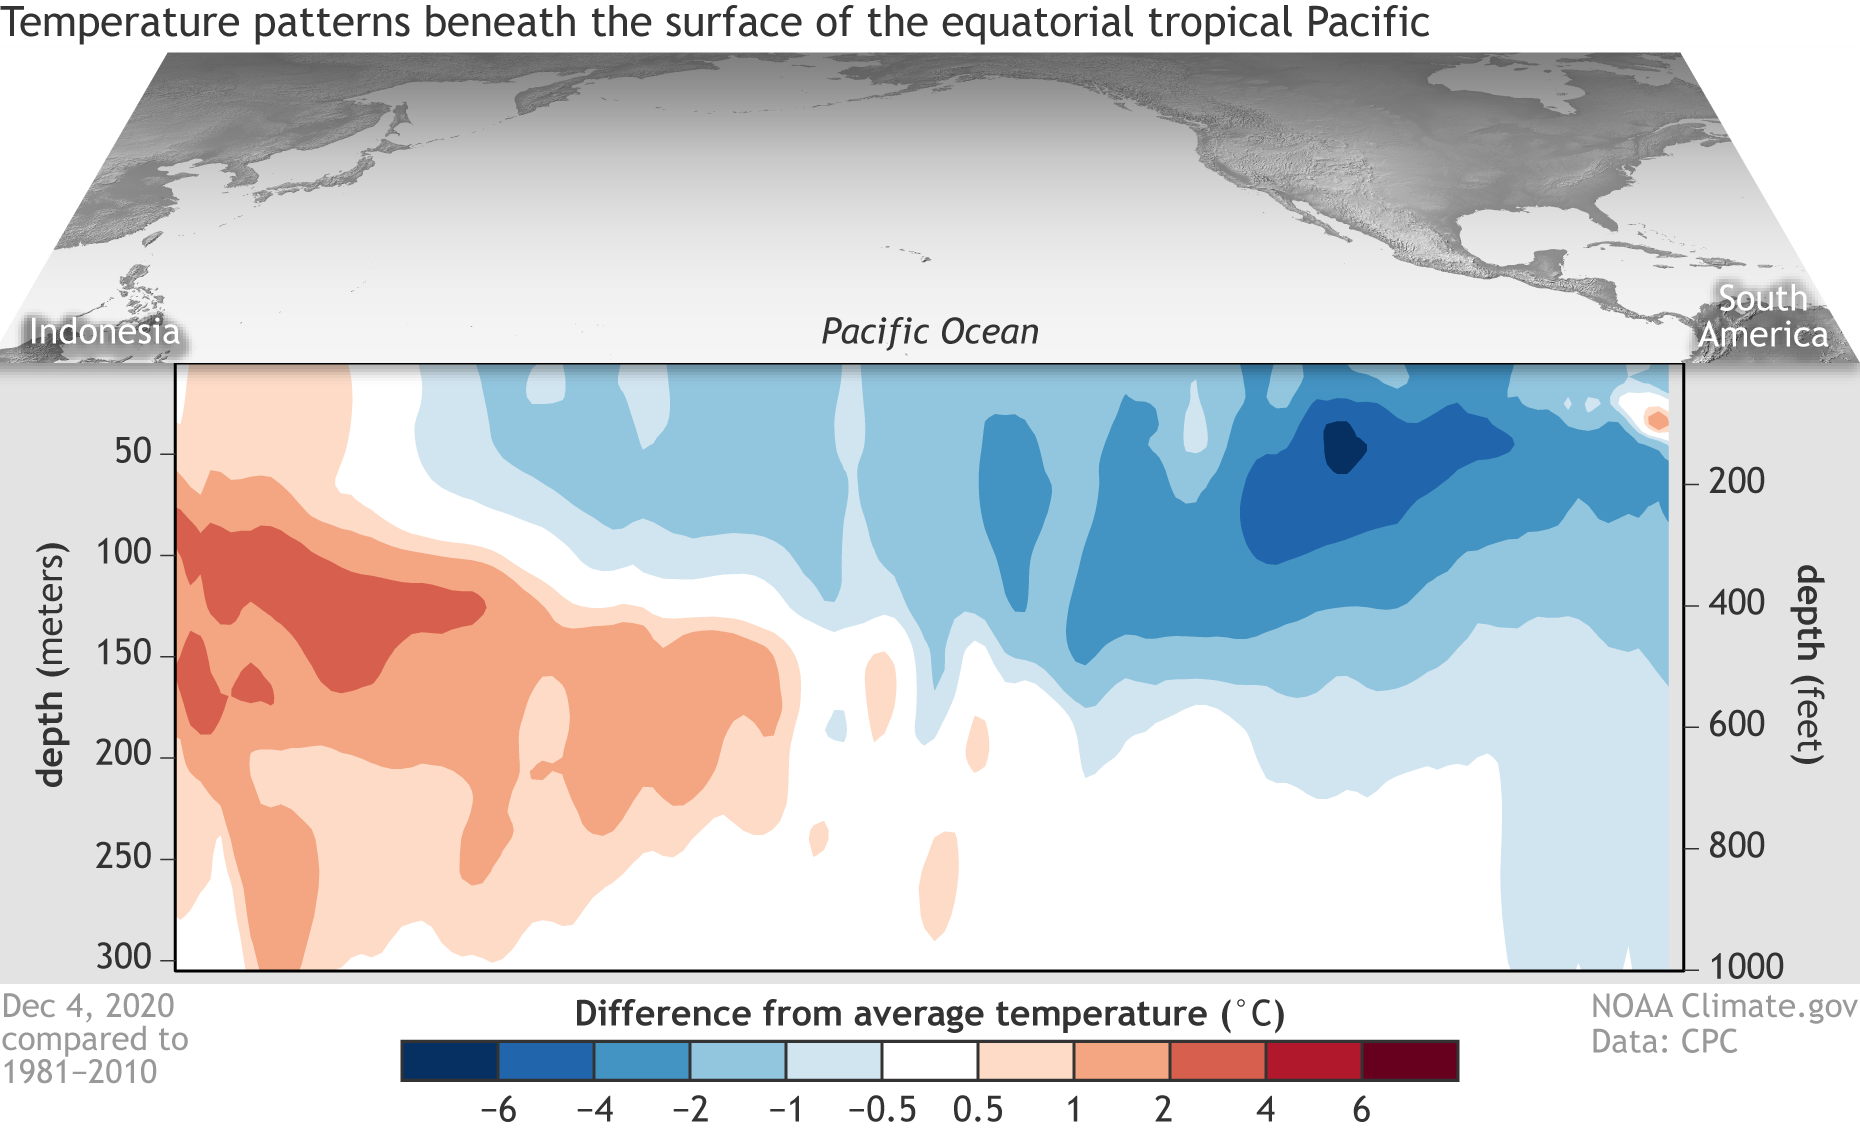
The maps above show conditions across the central and eastern Pacific Ocean as observed on November 25, 2020, and analyzed by JPL scientists. The globe on the left depicts sea surface height anomalies measured by the Jason-3 satellite. Shades of blue indicate sea levels that were lower than average; normal sea-level conditions appear white; and reds indicate areas where the ocean stood higher than normal. The expansion and contraction of the surface is a good proxy for ocean temperatures because warmer water expands to fill more volume, while cooler water contracts.
The second globe shows sea surface temperature (SST) data from the Multiscale Ultrahigh Resolution Sea Surface Temperature (MUR SST) project. MUR SST blends measurements of sea surface temperatures from multiple NASA, NOAA, and international satellites, as well as ship and buoy observations. (Scientists also use instruments floating within the sea to project underwater temperatures.)
“This 2020 La Niña seems to be peaking,” said Bill Patzert, a retired oceanographer and climatologist from JPL. “It was a bit of a surprise because it evolved quickly and unlike many previous La Niña events it was not preceded by its warm sibling, El Niño.”
This La Niña fits into a larger climate pattern that has been going on for nearly two decades—a cool (negative) phase of the Pacific Decadal Oscillation (PDO). During most of the 1980s and 1990s, the Pacific was locked in a PDO warm phase, which coincided with several strong El Niño events. But since 1999, a cool phase has dominated.
“With a few notable exceptions, the PDO has been negative for most of the past 20 years, and that is favorable for La Niña,” said Willis. “Drought patterns across the American Southwest over the past two decades fit with this trend.”
“The re-emergence of this large-scale PDO pattern tells us there is much more than an isolated La Niña occurring in the Pacific Ocean,” Patzert added. “These shifts can trigger decade or longer droughts in some regions and damaging floods elsewhere.”
In recent reports issued by the NOAA Climate Prediction Center and the World Meteorological Organization, climatologists forecasted that the current La Niña should last through the 2020-21 northern hemisphere winter. In late November, water temperatures in the central Pacific Ocean were roughly 1.4 degrees Celsius below the long-term average. A La Niña event is declared when average surface water temperatures stay at least 0.5° Celsius below normal in the Niño 3.4 region of the tropical Pacific (from 170° to 120° West longitude) for three months.
Later in 2021, scientists will have a new tool for observing La Niñas and other trends in global sea level. Following the successful launch of the Sentinel-6 Michael Freilich satellite in November 2020, scientists released some of the first measurements from the new ocean-observing satellite. Engineers and scientists are now calibrating instruments and analyzing data to make sure it correlates properly with long-term records.
“Christmas came early this year,” noted Willis, who is also NASA’s project scientist for the mission. “And right out of the box, the data look fantastic.”
NASA Earth Observatory image by Joshua Stevens, using data from the Multiscale Ultrahigh Resolution (MUR) project and sea surface height analyses courtesy of Akiko Hayashi/NASA/JPL-Caltech. Story by Michael Carlowicz.


