Editor’s Note—This article is one in a series about how NASA and other science institutions measure and monitor sea level rise. Find the other stories here.
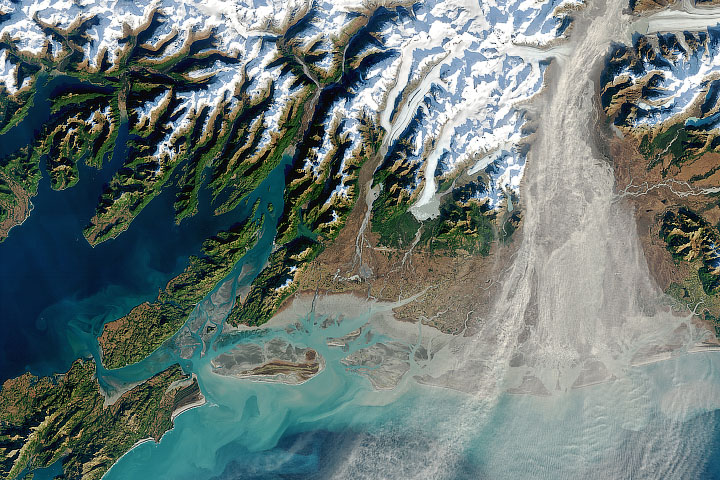
From a ship, a plane, or the beach, the oceans can look pretty flat and uniform. But in reality, the water in the ocean piles up in peaks and valleys. It stands higher on some shores than on others. It can slosh around in ocean basins like the water in a bathtub. The surface of the ocean rises and falls naturally, varying as much as 2 to 3 meters (6 to 10 feet) in places.
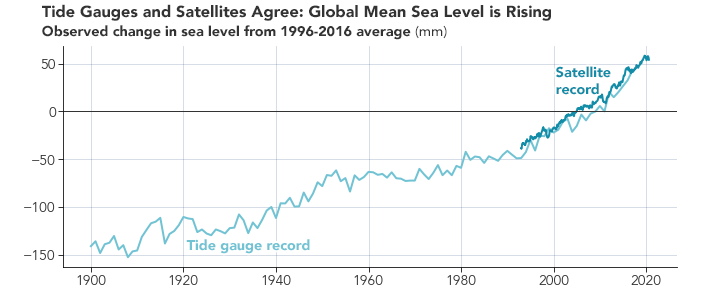
Scientists also know that the overall level of the sea has been rising around the world, and more in some places than others. They estimate that over the past 140 years, global mean sea level has risen 21 to 24 centimeters (8 to 9 inches).
There are many reasons why the ocean surface is lumpy. The friction between winds and water causes waves to build up. The tug of gravity from the Moon and Sun causes tides to rise and fall. The rotation of Earth (Coriolis effects) and the flow of currents also amass water in vast streams. Atmospheric pressure pushes and pulls on the water surface. Continents, islands, and even underwater seamounts exert a gravitational tug that draws water up around them.
We also know that seawater of different temperatures and salinities (salt content) can be more or less dense, filling more or less volume. For instance, scientists have known for decades that sea level is generally higher in the Pacific than in the Atlantic—about 20 centimeters (8 inches)—because Pacific waters are usually warmer, fresher, and less dense.
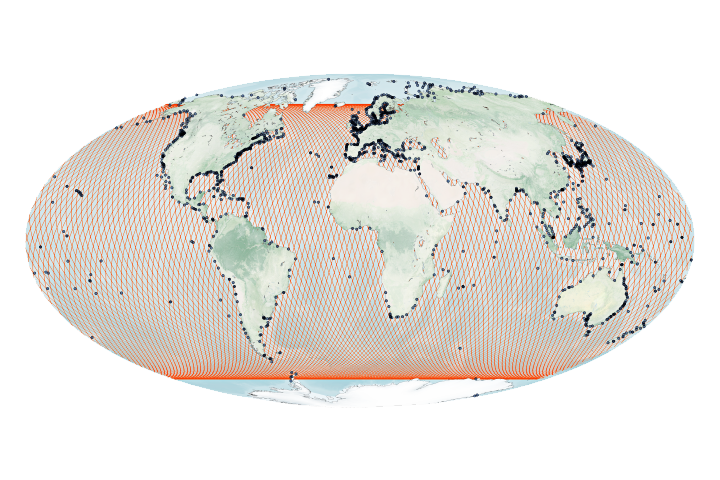
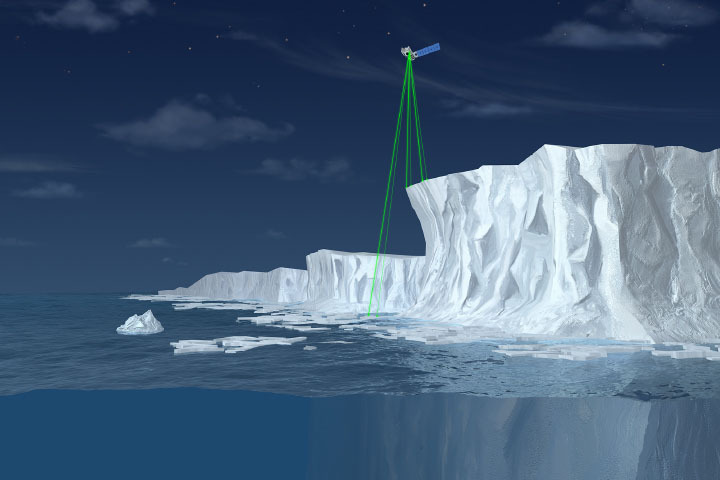
We know these things because we can measure them. For more than four decades, scientists have used satellite-based instruments known as radar altimeters to monitor ocean surface topography—the shape and height of the ocean’s peaks and valleys. Radar altimeters continually send out pulses of radio waves (microwaves) that bounce off the surface of the ocean and reflect back toward the satellite. The instrument calculates the time it takes for the signal to return, while also tracking the precise location of the satellite in space. From this, scientists can derive the height of the sea surface directly underneath the satellite.
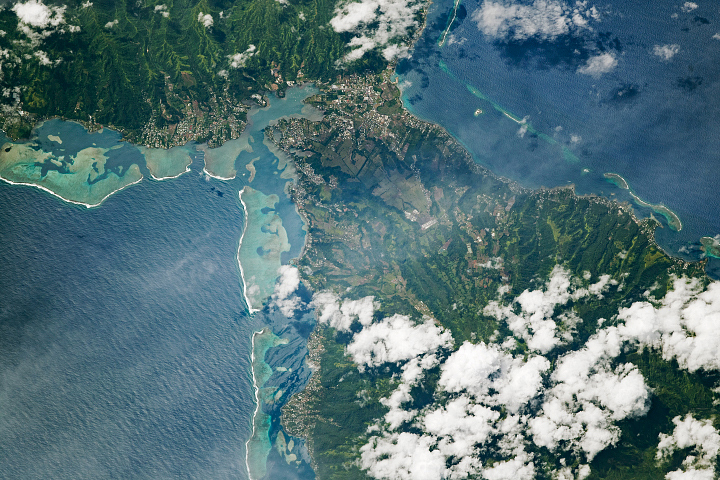
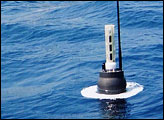
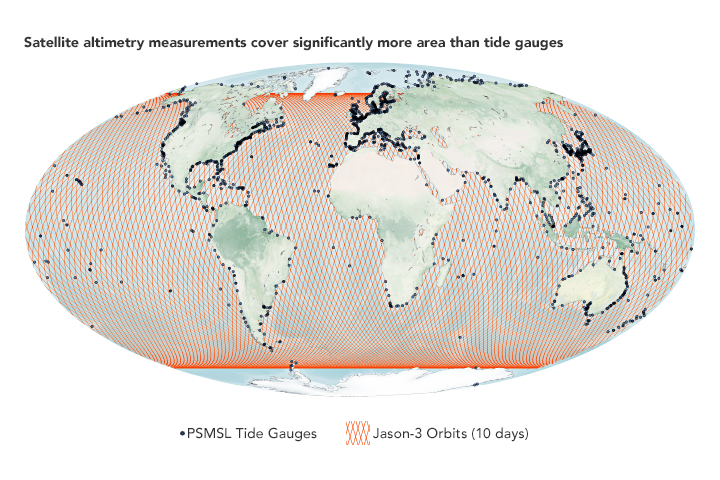
Long before there were satellites, scientists measured the height of the sea with tide gauges mounted in coastal bays and harbors. Collected in some places since the early 19th century, these records have provided one way to detect changes in the coastal ocean. But since landmasses and islands are unevenly distributed among the world, and tide gauges tend to be clustered on the shores of wealthier countries, the view has been limited. Still, there is value in long-term records, and readings from more than 1500 tide gauges have been compiled and analyzed by research groups like the Permanent Service for Mean Sea Level. Their data help corroborate what satellites observe.
In the Space Age, altimetry satellites have been building upon the tide gauge records. Since 1992, four missions have used very similar instruments and have repeated the same orbit every ten days: TOPEX/Poseidon (1992-2006), Jason-1 (2001-2013), Ocean Surface Topography Mission/Jason-2 (2008-2019), and Jason-3 (2016 to present). The missions were built through various partnerships between NASA, France’s Centre National d'Etudes Spatiales (CNES), the European Organisation for the Exploitation of Meteorological Satellites (EUMETSAT), the European Space Agency, and the U.S. National Oceanic and Atmospheric Administration (NOAA).
Known to the science community as the “reference missions,” these altimetry satellites have been making standardized measurements of the fluctuations of sea level near and far. They provide a unified ocean topography record and the equivalent coverage of a half-million tide gauges. (Other altimetry missions employ different approaches and orbits to study ocean topography and further complement this record.) Two more successor satellites have been built to extend this reference record for another decade; the first of these, Sentinel-6 Michael Freilich, is scheduled to be launched in late 2020.
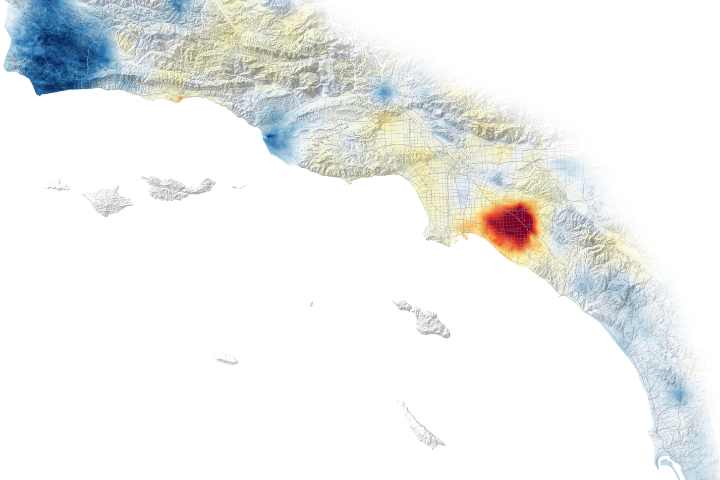
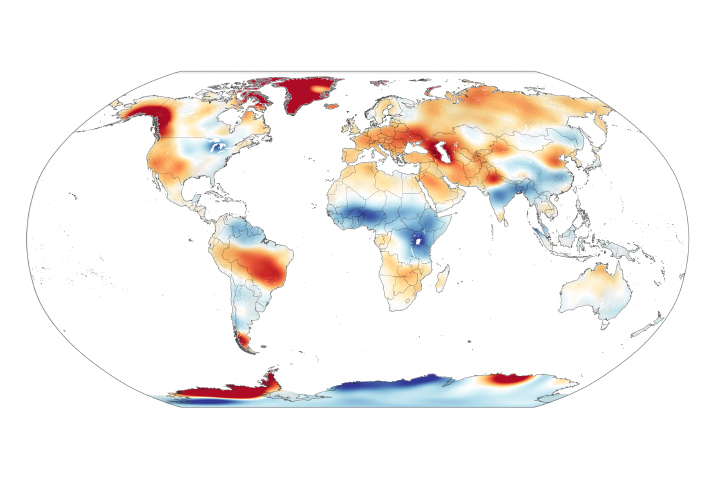
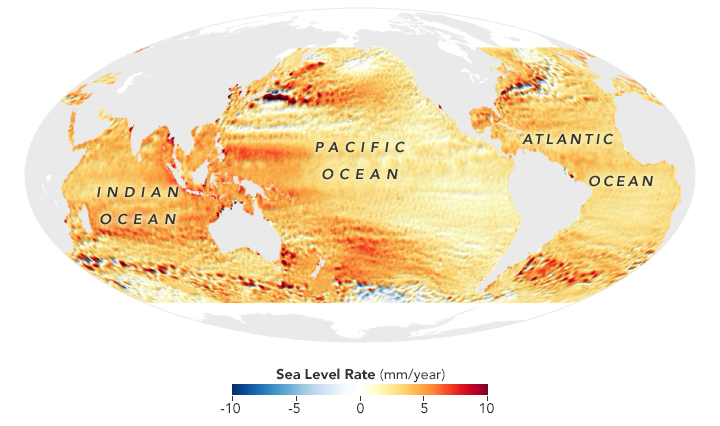
The map at the top of this page shows global trends in sea level around the world as observed from 1993 to 2018 by TOPEX-Poseidon and the three Jason altimetry missions. There are spatial variations in the rate of sea level rise, with some parts of the ocean rising faster (depicted in red and deep orange) than the global rate.
Spotting a few millimeters of change amid the dynamic churning of the ocean is a challenge. The satellite has to look down through 1300 kilometers (800 miles) of atmosphere. While clouds are no trouble for radar—which penetrates cloud cover—the amount of moisture in the air slows down the radio signal and can make the ocean appear higher or lower than it actually is. To compensate for this, engineers have built instruments into the satellites to measure water vapor and account for its effects.
Another challenge is knowing the exact height of the satellite—researchers call it “precise orbit determination.” Each altimetry satellite has reflectors that can bounce laser signals from ground stations to measure altitude. The satellites also have Doppler and Global Positioning System receivers to further pinpoint location. The goal is to know exactly how far the satellite is from the center of the Earth at any moment. Finally, the orbital pattern takes the satellites directly over tide gauge stations on the French island of Corsica and an oil rig off of California to simultaneously measure sea level from above and at the surface every ten days.
Even when scientists account for all of the variables in measuring sea level, the planet offers more complications: sea surface patterns and rhythms that can span years and decades. Climate patterns such as El Niño and La Niña, the Pacific Decadal Oscillation, the North Atlantic Oscillation, and the Indian Ocean Dipole all cause water to warm or cool, rise and fall, and slosh around the ocean basins. Even major current systems can speed up or slow down.
Scientists have accounted for that, too. By analyzing sea surface data over long periods and noting the occurrence of major events like El Niño, they can identify and remove the natural cycles to spot the comparatively small changes in overall sea level. This is why radar altimeters are now in their fifth generation: they have collectively accumulated a data record that is longer than the seasonal, yearly, and even decadal cycles.
What scientists have found after all of that data gathering and cross-checking is that global mean sea level has risen a total of 95 millimeters (3.7 inches) since TOPEX-Poseidon first started flying in 1992. And the rate is accelerating. Over the course of the 20th Century, sea level rose at about 1.5 mm per year; in the early 1990s, the rate was about 2.5 mm per year. Over the past 30 years, the average rate has increased to 3.4 millimeters (0.13 inches) per year.
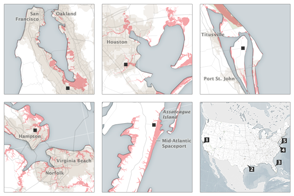
That total rise in seal level is a global average, and the numbers can be significantly higher in some places. (See the map at the top of the page.) For instance, researchers have observed that sea level along much of the East Coast of North America has been rising faster than the global average.
While a few millimeters of higher water may seem small, scientists estimate that every 25 millimeters (1 inch) of sea level rise translates into 2.5 meters (8.5 feet) of lost beach along our coasts. It also means that high tides and storm surges can rise even higher, bringing more coastal flooding, even on sunny days. Some estimates suggest seas could rise another 650 millimeters (26 inches) by the year 2100 if Earth’s ice sheets and glaciers keep melting and its waters keep warming.
Ocean altimeters alone cannot tell us why seas are rising; other instruments and data sets are needed to tell us that. But together with tide gauges, these satellites tell us clearly that our planet is changing. And they help us see more clearly where that is happening.
Find more stories about our changing oceans and coasts in Earth Observatory’s sea level rise collection. Explore other stories of sea level by our NASA colleagues in Rising Waters.
Looking for data related to sea level rise? The Sea Level Change Data Pathfinder on NASA’s Earthdata site highlights tools used by researchers to study ocean altimetry, including the Integrated Multi-Mission Ocean Altimeter Data for Climate Research.
NASA Earth Observatory images by Joshua Stevens, using TOPEX/Poseidon, Jason-1, Jason-2, and Jason-3 data courtesy of Ben Hamlington, NASA/JPL-Caltech, and tide gauge data from Permanent Service for Mean Sea Level (PSMSL). Video by NASA/JPL-Caltech. Story by Michael Carlowicz, with science interpretation by Ben Hamlington/NASA JPL, Richard Ray/NASA Goddard, and Josh Willis, NASA JPL.