
Editor’s Note —This story is excerpted from our recent feature, Of Mosquitoes and Models: Tracking Disease by Satellite.
In 1952, a new and unusual virus was reported in southern Tanzania on the Makonde Plateau. The viral illness caused sudden fever, rash, and joint pain that could last for months. Sometimes causing victims to hunch over due to the aches, the virus was called chikungunya—meaning “bent over in pain” in the local Makonde language. The virus is rarely fatal, but symptoms can last for a few days. It has no vaccine or antiviral treatment.
For the next 50 years, chikungunya was largely dormant, with only a few small outbreaks and sporadic cases. But then it made a large-scale resurgence. At first, it appeared along the Kenyan coast in 2004 in Lamu and then Mombasa. During 2005-2006, the virus spread to hundreds of thousands of people living on western Indian Ocean islands and in India. A decade later, chikungunya became national news with almost 900 reported cases in the U.S. in 2015.
As these chikungunya outbreaks were occurring, scientist Assaf Anyamba noticed an interesting trend: the mosquito-borne outbreaks were happening during drought conditions.
“Many people think you get rain, then mosquitoes come, and then disease occurs,” said Anyamba, a remote sensing scientist with the NASA Goddard Earth Sciences & Technology Center. “But these large-scale outbreaks illustrated the role of extreme temperatures in influencing these particular vectors.”
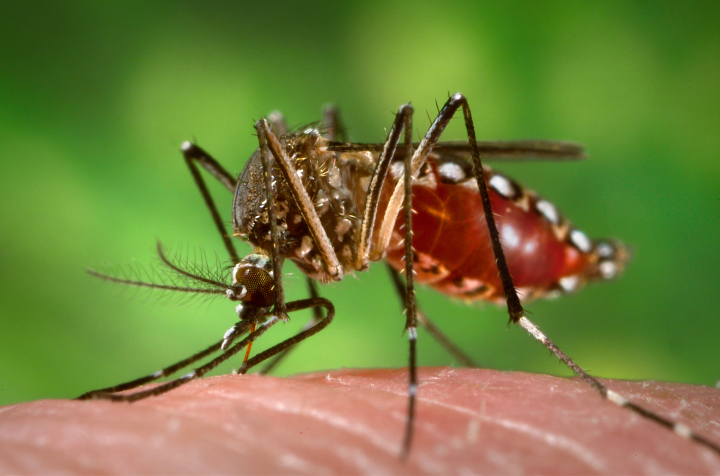
Chikungunya is transmitted through the bite of infected Aedes aegypti and Aedes albopictus mosquitoes. The insects typically gravitate to areas where there is open water for laying their eggs. During a drought, they will leave dry rural areas and move towards urban areas, where open water can be found in water storage containers, flower pots, or small puddles. High temperatures also agitate the insects and cause them to bite more, increasing transmission of the disease.
Since 2016, Anyamba and his research team have been working on a chikungunya risk mapping and forecasting system called CHIKRisk. The group provides monthly outlooks of where chikungunya risk is highest around the world. The map at the top of this page shows the outlook for August 2020, which shows an elevated risk for chikungunya in India, Mexico, Indonesia, Malaysia, and Philippines.
The model works by tracking a variety of environmental satellite and ground data: air temperature and rainfall data from NOAA models; land surface temperatures from NASA’s Moderate Resolution Imaging Spectroradiometer (MODIS) instruments; humidity and soil moisture data from NASA’s Global Land Data Assimilation System; human population density data from NASA’s Socioeconomic Data and Applications Center; and chikungunya vector distributions from the Walter Reed Biosystematics Unit’s VectorMap. The model is correlated with ground-based surveillance systems (such as the Program for Monitoring Emerging Diseases) that identify disease activity.

“You have to determine where there are disease-favoring conditions in the environment, and you can only determine that by a global surveillance system, which satellites provide,” said Anyamba.
CHIKRisk is currently used by the U.S. Department of Defense’s Global Emerging Infections Surveillance (GEIS) system for situational awareness and health protection for soldiers stationed overseas; it is also used by the Pan American Health Organization (PAHO) to help control chikungunya in high-risk areas. The project is partly supported by the U.S. Defense Threat Reduction Agency and the NOAA Climate Program Office.
Anyamba said the next step is to create one model that could be applied to forecast a multitude of diseases, especially those from the same vector (organisms that do not cause the disease, but spread it to other animals). Aedes aegypti and Aedes albopictus mosquitoes are notable vectors in the disease world because of their diversity and ubiquity. Not only do they carry chikungunya, but they also carry dengue fever and Zika. From a modeling perspective, the prediction parameters should be similar for all three diseases. Theoretically, forecast maps could cover multiple diseases for a single location if they have similar environmental influences or common vectors.
“When people go into hospitals, their symptoms may be related to many diseases. Until they perform the right test on you, they cannot confirm the disease,” said Anyamba. “Our hope is to make disease forecast maps that could tell public health practitioners that they should be looking for chikungunya, dengue, and Zika.”
NASA Earth Observatory map by Lauren Dauphin using data from Assaf Anyamba, NASA GSFC. Photograph courtesy of CDC/James Gathany. Story by Kasha Patel.