The Earth Observatory has published its last Image of the Day on this website. Please join us on our new home at science.nasa.gov/earth/earth-observatory.
Slow-moving landslides—places where the land creeps sluggishly downhill over long periods of time—are relatively stable until they aren’t. But because landslides are often inaccessible and do not respond uniformly to changes, they can be difficult to predict.
Through the study of an unusual, long-lasting slide, a research team from the University of California, Berkeley, NASA’s Jet Propulsion Laboratory (JPL), and the U.S. Geological Survey (USGS) has developed a new technique to make prediction both easier and more accurate. The team centered their research on the 4-kilometer (2.5-mile) long Slumgullion landslide in southwestern Colorado. In motion for more than a century, the landslide provides an ideal natural laboratory for studying the dynamics of slow-moving landslides.
“It’s important to understand how landslides work and how they respond to environmental changes so that we can better predict when they might transition from this gradual motion to a more rapid, catastrophic failure,” said JPL scientist Eric Fielding, a coauthor of the new study. When landslides become unstable due to heavy rain, snowmelt, earthquakes, or volcanic activity, they can quickly turn destructive, especially in populated areas.
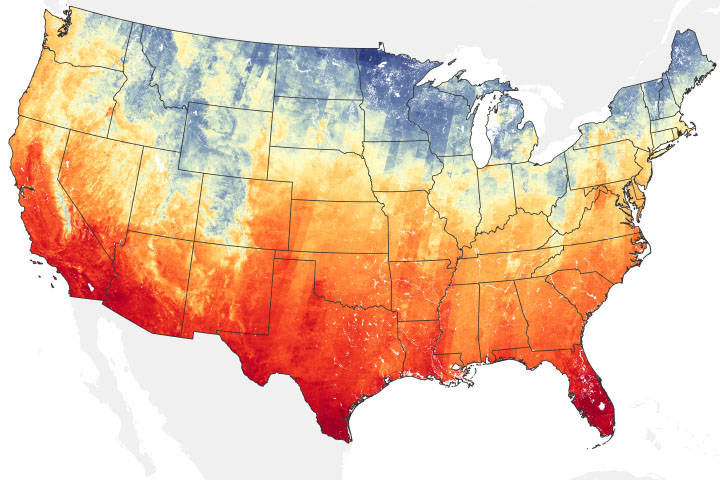
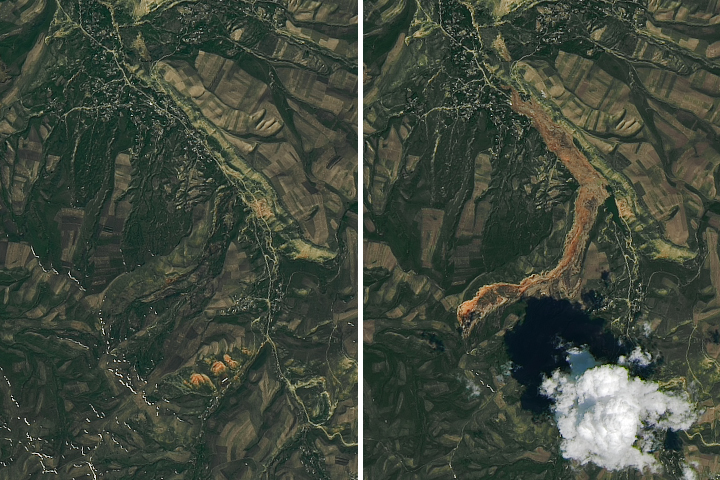
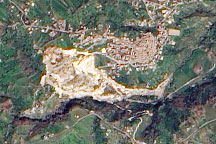
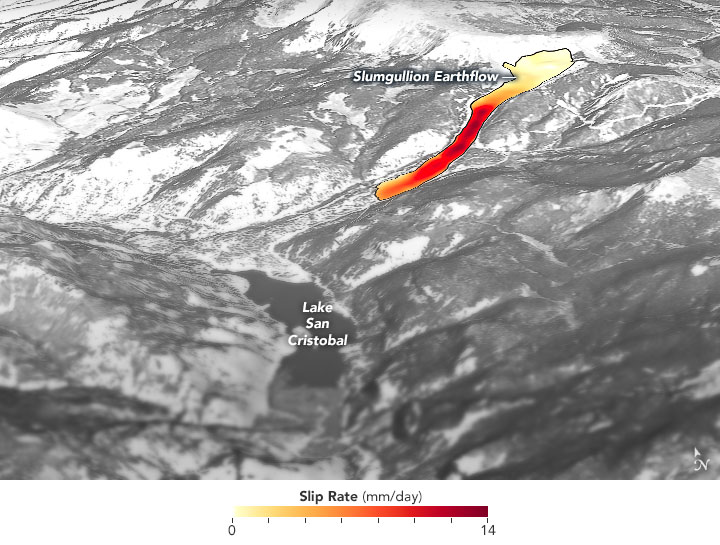
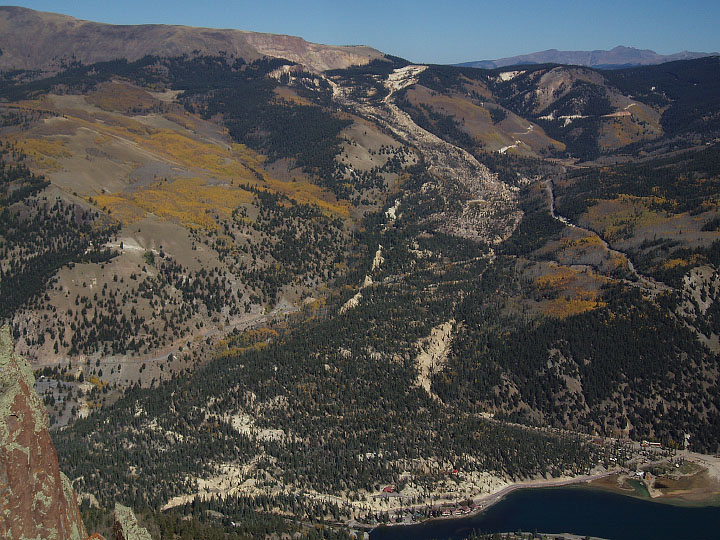
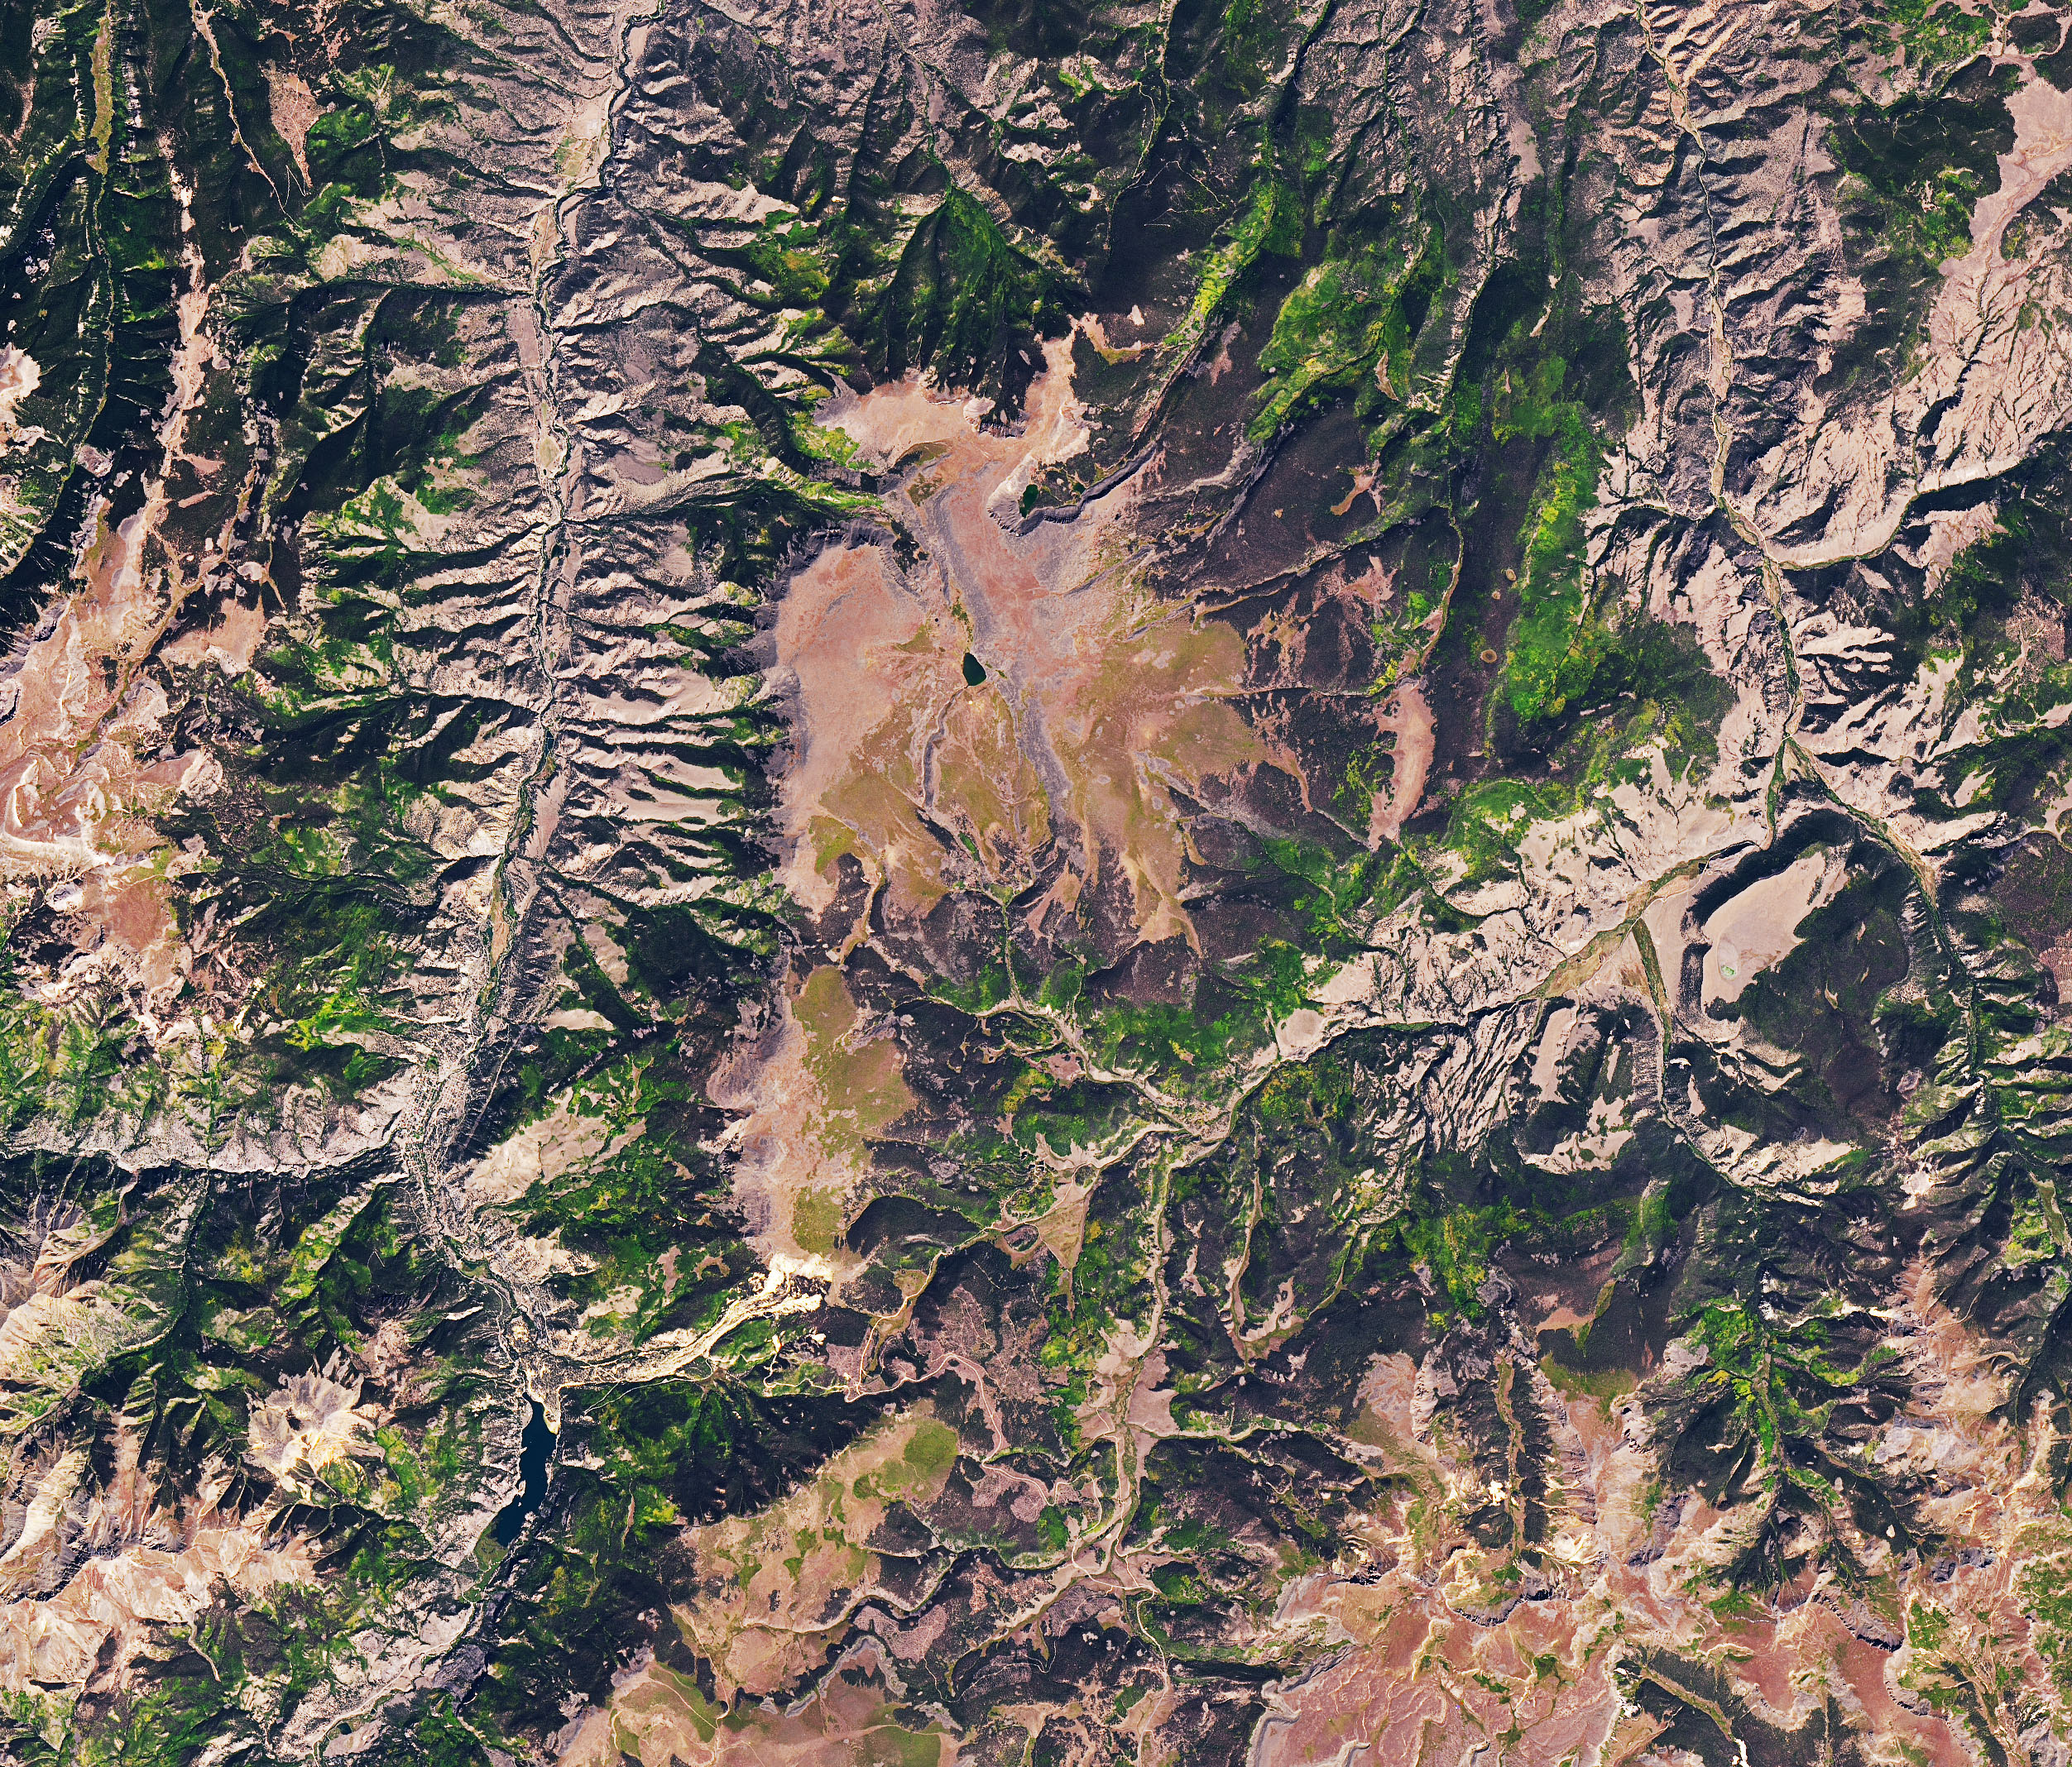
The map above shows where and how quickly land is sliding within the Slumgullion landslide (also known as an earthflow). Land depicted in dark red was found to be sliding as much as 14 millimeters (0.55 inches) per day. The map is derived from data collected during multiple research flights from 2011 and 2018 by the Uninhabited Aerial Vehicle Synthetic Aperture Radar (UAVSAR); those data are overlaid on a digital elevation model from the Shuttle Radar Topography Mission. The photograph below shows the Slumgullion Landslide as observed by Bill Schulz of USGS. The natural-color satellite image near the bottom of the page was acquired on September 25, 2019, by the Operational Land Imager (OLI) on Landsat 8.
“By combining multiple datasets from the subsurface, ground surface, air, and space, we constructed a mechanical framework to quantify different features and movements of the landslide,” said lead author Xie Hu of UC Berkeley. “High-resolution synthetic aperture radar data from JPL’s airborne UAVSAR instrument was particularly important in developing this framework.”
Attached to the bottom of an airplane, UAVSAR collects radar images of Earth’s surface that can be used to map changes to the land surface (deformation) with centimeter-scale precision. When the instrument is flown over the same area multiple times, scientists can then glean how much the land has moved and in which direction. Because the instrument is attached to a plane, they can design flight plans to make multiple passes over precisely the same area in a short amount of time.
“By flying over this landslide multiple times, in different directions at perpendicular angles, we had sufficient data to reconstruct the full three-dimensional motion in very clear detail, as well as how it varies over the years,” said Fielding.
According to coauthor Bill Schulz, most of the action happens at the bottom of the landslide, with everything sliding on a thin shear zone that may be only a few centimeters thick. Because the depth can vary greatly across a single landslide, different parts of the slide will respond to changes in pressure at different times.
“Groundwater pressure—from rain and snowmelt, for example—changes first right at the ground surface and last at the bottom of a landslide,” said Schulz. “So if one area of a landslide is half as deep as another, the area that is half as deep will respond first to the change in pressure.” UAVSAR does not directly measure deformation at depth, but the researchers were able to integrate the radar data with field measurements to model the various depths and movements of the slide.
The study provided insights specific to the Slumgullion slide. “We found that the central part of this landslide moves quickly—about an inch per day, every day. But in observing all of the data over time, we see that the top and bottom parts are moving, too, just far more slowly,” said Fielding. “We also found that the uppermost part of the landslide responds most quickly to spring snowmelt, and that the central part responds significantly to annual variation: drought years versus wet years.”
The study was published on June 3 in Nature Communications.
NASA Earth Observatory images by Joshua Stevens, using data courtesy of Hu, X., et al. (2020) and Landsat data from the U.S. Geological Survey. Photograph by Bill Schulz/USGS. Story by Esprit Smith, NASA’s Earth Science News Team, with Mike Carlowicz.