
Birds are pretty sensitive when it comes to temperature. Some species struggle to keep warm during cold winters. Other birds have expanded their range northward as global climate has warmed. It turns out scientists can use this close relationship between temperatures and bird behavior to predict bird biodiversity.
One way that ecologists assess biodiversity is by measuring the number of different species present in a given location—a measure that scientists call “species richness.” Information on species richness is useful for guiding conservation efforts, such as how to manage a landscape. But wildlife data can be relatively sparse and often reliant upon people in the field conducting surveys.
“To get around that issue, we try to think of variables that accurately represent where birds occur and can be more readily measured over large scales,” said Paul Elsen, a postdoctoral researcher at University of Wisconsin-Madison when the study was conducted. “Things like elevation and habitat have been used a lot for this, but we also know that temperature is a very important factor for birds.”
To map temperature patterns across the continental United States, Elsen and colleagues compiled data acquired from 2013 to 2018 by the Thermal Infrared Sensor (TIRS) on Landsat 8. They focused on data from December through February, the cold winter months when birds are most affected by temperature. Then the researchers compared their temperature maps with existing ground-based surveys for large and small resident (non-migratory) birds.
The map at the top of this page shows relative temperatures during the winter across the United States. Note that the temperatures are not quite the same as you would measure from the ground; rather, they show where temperatures are warmer (red) or cooler (blue) than the median temperature detected. The most obvious pattern that emerges is an intuitive one—the country is generally warmer in the south and colder in the north.
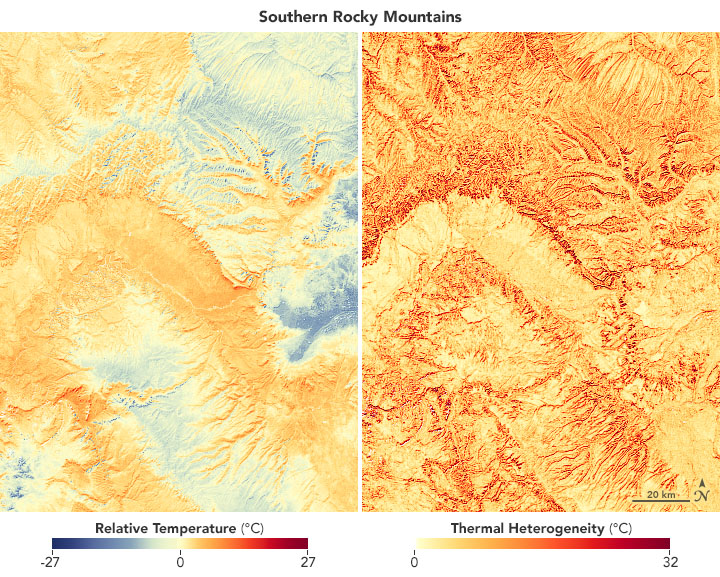
The second map above, also derived from TIRS data, shows the magnitude of these temperature differences, or “thermal heterogeneity”—that is, how much temperatures differ across small distances in the landscape. Higher values (red) indicate a greater temperature difference and lower values (yellow) indicate temperatures that are relatively similar. The map shows that the largest differences tend to occur around mountains. Again, the pattern is intuitive: when you are hiking a mountain, the temperature can change drastically as you gain or lose elevation.
Ground-based survey data indicated that both small and large birds tend to prefer locations with higher overall winter temperatures. Detailed maps show, however, that there can be quite a bit of variation on local scales. Places that are generally cold in winter can still have areas of relative warmth and potential bird habitat.


The first detailed map pair above shows relative temperature (left) and thermal heterogeneity (right) in the southern Rocky Mountains (top). Note the large temperature variations. This is common in mountain environments, where temperatures can change over very short distances due to factors such as elevation.
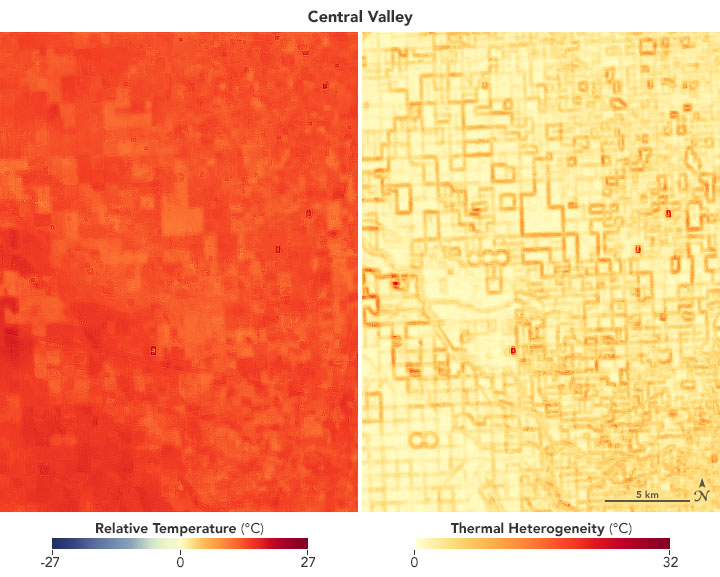
The second pair shows relative temperature (left) and thermal heterogeneity (right) in California’s Central Valley. They show that differences in temperature are not just driven by differences in elevation; they can also be influenced by the region’s farms and orchards.
“Land cover also influences the thermal environment, and we can really see that in the agriculture map,” Elsen said. “This is a very flat landscape, but there are a lot of different temperatures because there are different kinds of crops creating different local temperature conditions.”
Small birds do not regulate their body temperature as well as large birds, and they generally do not move as far in search of warmer environments. Ground-based survey data confirm that small birds prefer landscapes with larger thermal differences, likely because they offer more opportunities to find refuge from the cold.
In their paper, Elsen and colleagues go on to show that the relationship between temperatures and bird behavior can be used in models to accurately predict bird species richness during the winter. “That means we can make some fairly good predictions about how species might respond to future temperature changes,” Elsen said.
He cautions, however, that the predictions are limited to the winter season. “We know through subsequent work that the relative temperature and thermal heterogeneity patterns we observed during winter are actually fairly different in summer,” Elsen said. “This means we would have to be careful to make predictions about other time periods.”
NASA Earth Observatory images by Joshua Stevens, using Landsat data courtesy of Elsen, P., et al. (2020). Photo by Amanda Frank via Unsplash. Story by Kathryn Hansen.