The Earth Observatory has published its last Image of the Day on this website. Please join us on our new home at science.nasa.gov/earth/earth-observatory.
Skin cancer is the most common form of cancer in the United States, taking thousands of lives every year. By the age of 70, one in five Americans will develop skin cancer. Now NASA is helping public health officials track the primary cause of the disease: overexposure to ultraviolet radiation.
The NASA Applied Sciences Program has partnered with the Centers for Disease Control and Prevention (CDC) to create the first publicly available map of ultraviolet (UV) radiation for all counties in the contiguous United States. The dataset, which spans 2005-2015, is available on the CDC's National Environmental Public Health Tracking network, which delivers information and data about health issues related to environmental factors. Public health officials, city planners, or individuals concerned about Sun exposure can learn how much ultraviolet radiation is falling over each county each month, which is an important step in helping reduce skin cancer risks.
“Before this, there hasn’t been a true comprehensive exposure measure of UV radiation,” said Yang Liu, an associate professor at Emory University’s Rollins School of Public Health. “People have been studying Sun exposure using very crude indicators. We’re looking at the specific UV wavelengths that can cause skin cancer.”
Although skin cancer is caused by ultraviolet radiation, different types of UV radiation can have different effects. The two that play an important role in skin cancer are UVA and UVB rays. UVA rays penetrate deeply into the skin to cause genetic damage to cells; UVA is linked to long-term skin damage such as wrinkles. UVB are the principal rays that cause sunburn and can directly damage the DNA in skin cells.
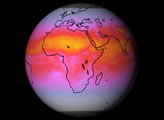
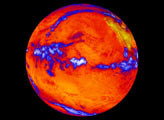
The maps on this page show the average amount of UV radiation per square meter reaching the surface in different parts of the country. Liu and his team used an equation to combine the various wavelengths of UV radiation to mimic the intensity of a sunburn—a measurement called the “erythemally weighted daily dose.” The researchers also gave more weight to more populated areas. For instance, the measurement is higher in more populated areas, which is helpful for studying the corresponding population health effects of high UV exposure.
“Think of this like a risk map, showing the likelihood of a person getting sunburnt in an area,” said Liu. “The idea is to produce a UV exposure indicator that may be used by public health researchers to link to skin cancer incidences.”
The top animation shows monthly averages in 2015. The figures below show the monthly average in January, when UV exposure is lowest, and June, when exposure is highest. The UV data comes from the Ozone Monitoring Instrument on NASA’s Aura satellite. The data were processed by the research team at Emory University and University of Iowa.
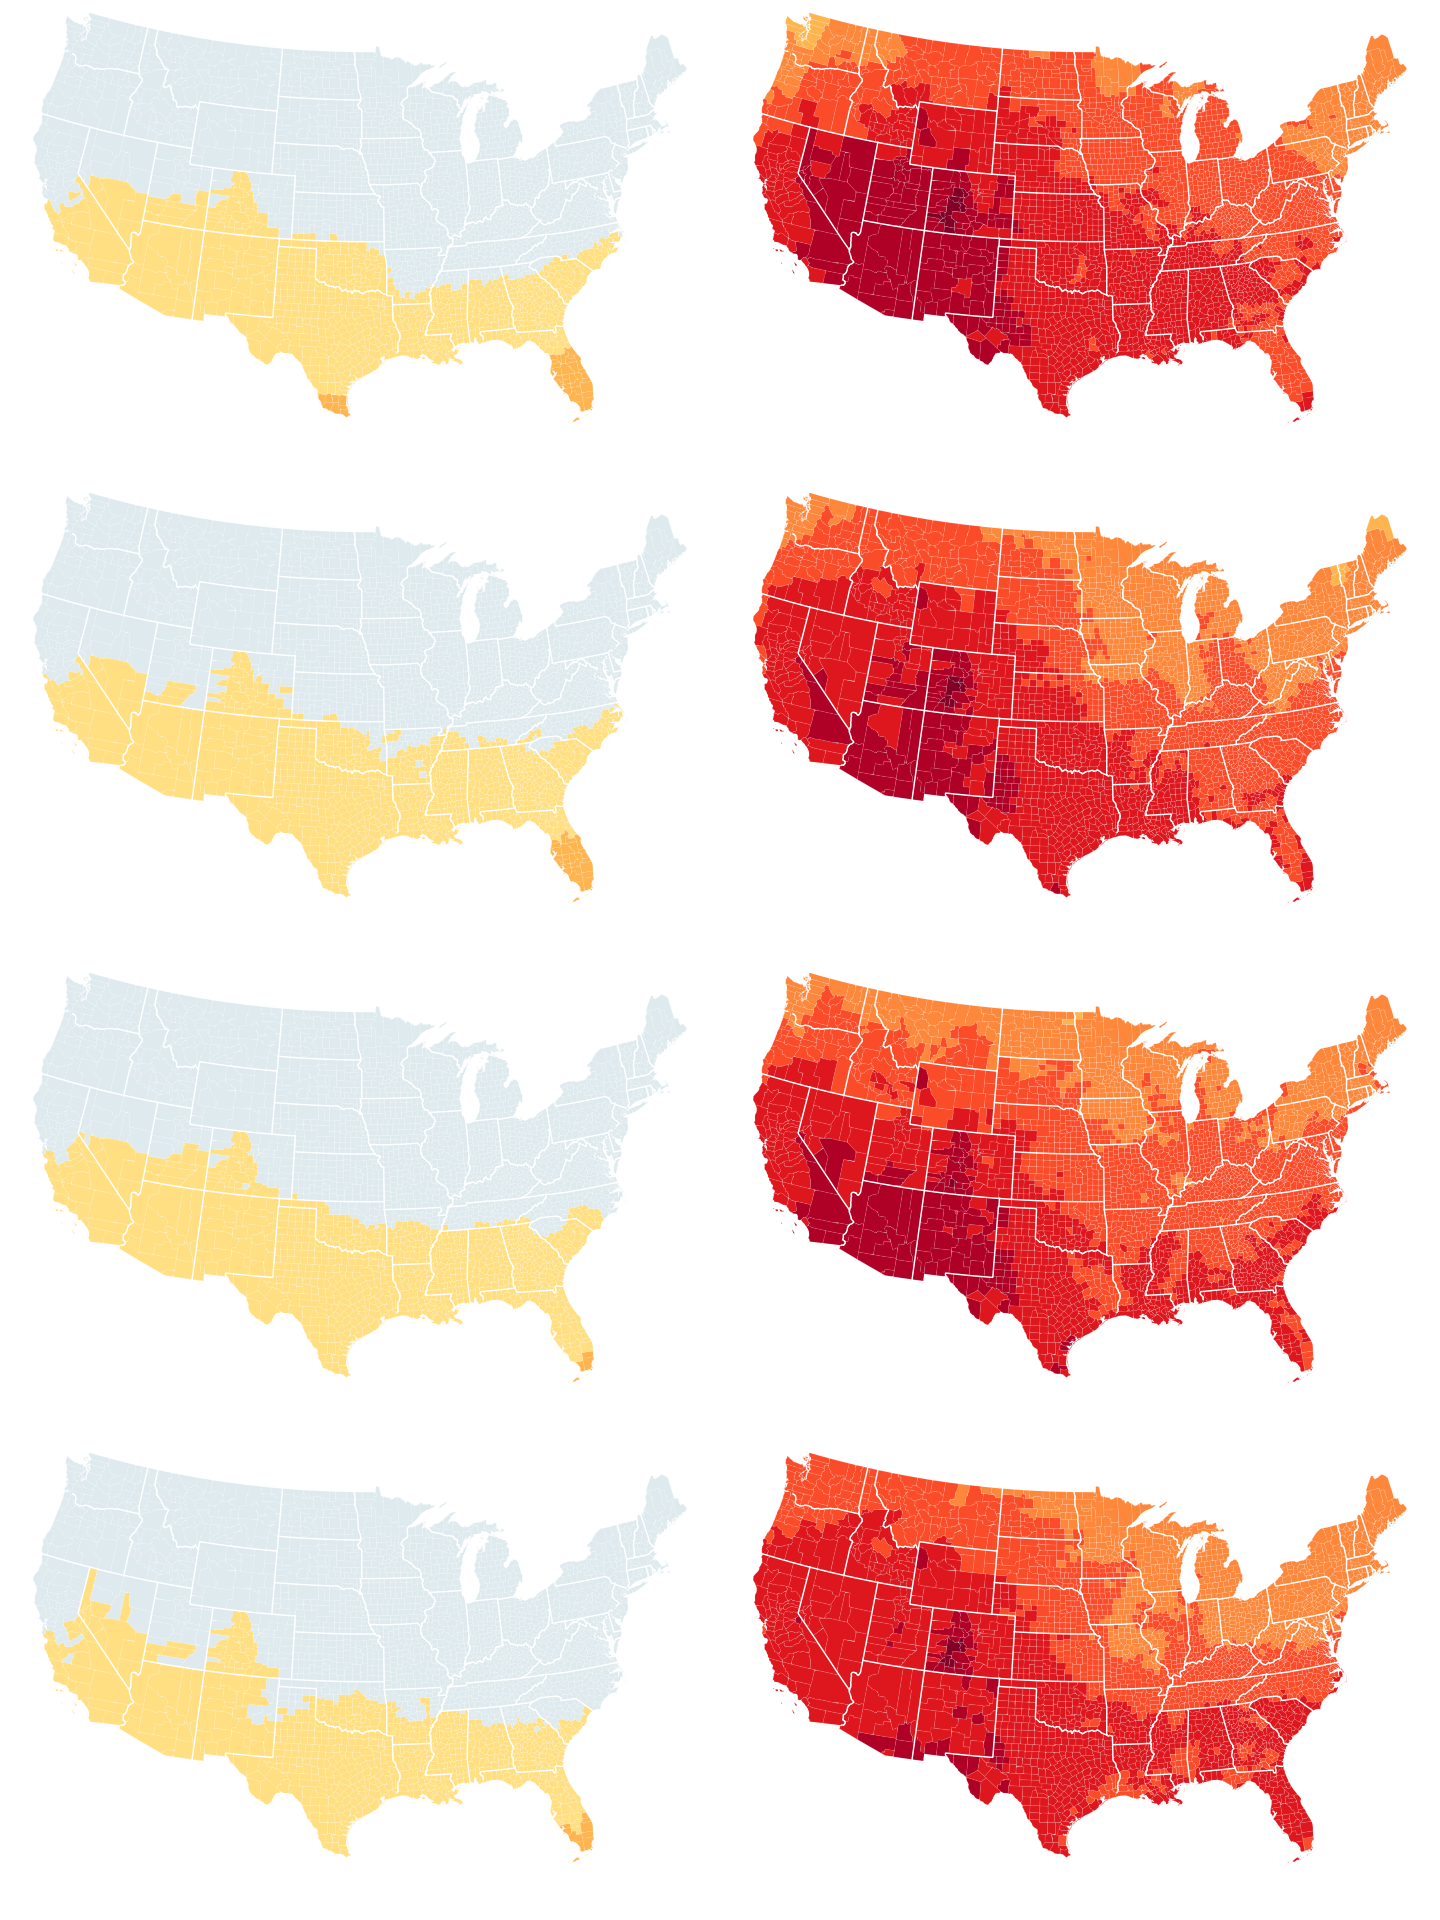
The researchers found that national UV radiation levels increased significantly from 2005 to 2015. Specifically, they saw increases in the southern and western U.S., which was most likely due to higher altitudes. Generally, UV radiation levels are higher at higher altitudes as the air is thinner, dryer, and cleaner and has less scattering and absorption of UV.
But it is not clear what the main driver of this increase in UV exposure is, said Liu. Possible factors are decreasing surface ozone or aerosol emissions, or a change in cloud cover. In order to understand finer intricacies in the data, Liu says they need a longer time series. But the data is still helpful for learning about potential human impacts.
“This is the first time we’ve had this national data set of UV exposure,” said Heather Strosnider, leader of the science development team at the CDC’s Environmental Health Tracking Section. “This data can help us learn more about the populations at risk and could even help us identify areas for skin cancer prevention outreach.”
Strosnider looks forward to pairing this information with other datasets to identify areas of concern based on both increased UV exposure and additional risk factors for skin cancer such as employment in professions that require more time in the Sun.
NASA Earth Observatory images by Joshua Stevens, using Ozone Monitoring Instrument (OMI) data from the Centers for Disease Control and Prevention (CDC) and Zhou, Y., et al. (2019). Story by Kasha Patel.