The Earth Observatory has published its last Image of the Day on this website. Please join us on our new home at science.nasa.gov/earth/earth-observatory.
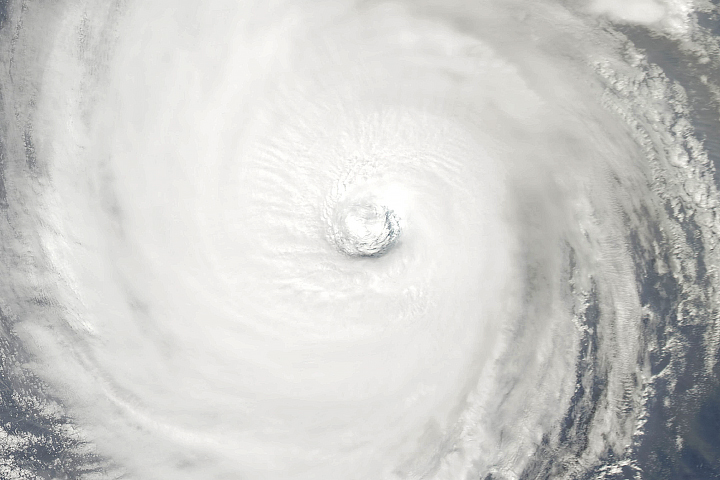
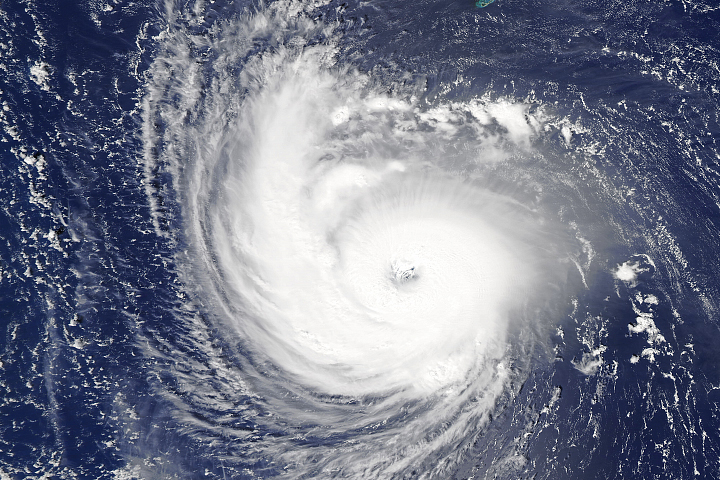
For the CloudSat science team, getting a view inside the eye of a typhoon is not something that happens every day.
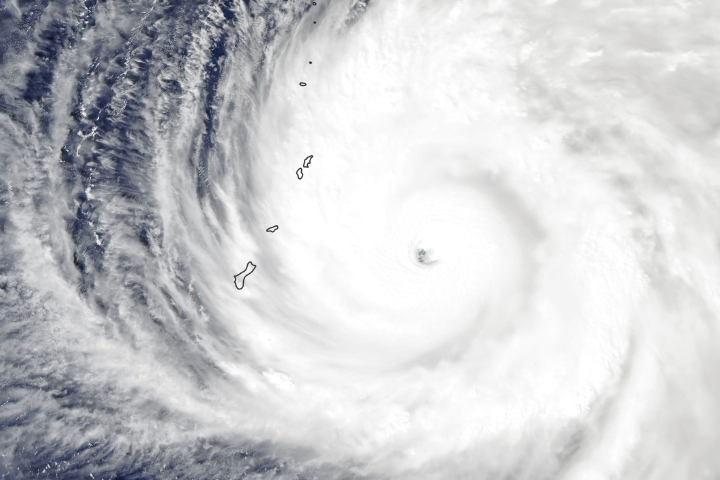
Earth’s total surface area is 510 million square kilometers (197 million square miles); the satellite’s cloud-penetrating radar sees just 1.4 square kilometers at a time. Meanwhile, the eyes of typhoons and hurricanes typically range from 30 to 65 kilometers.
For CloudSat, grazing tropical cyclones is relatively common. The satellite has come within 1,000 kilometers of tropical cyclone centers more than 10,000 times since the mission began in 2006. But for systems that reached typhoon strength, overpasses within 25 kilometers of the storm center have happened just 42 times. Overpasses of major storms—those with sustained winds above 178 kilometers (111 miles) per hour—are even rarer. That has happened just 19 times.
“With so many near misses, it is a thrill to see right into the heart of a storm,” said Natalie Tourville, a Colorado State University research meteorologist who has compiled a database of all of CloudSat’s storm overpasses.
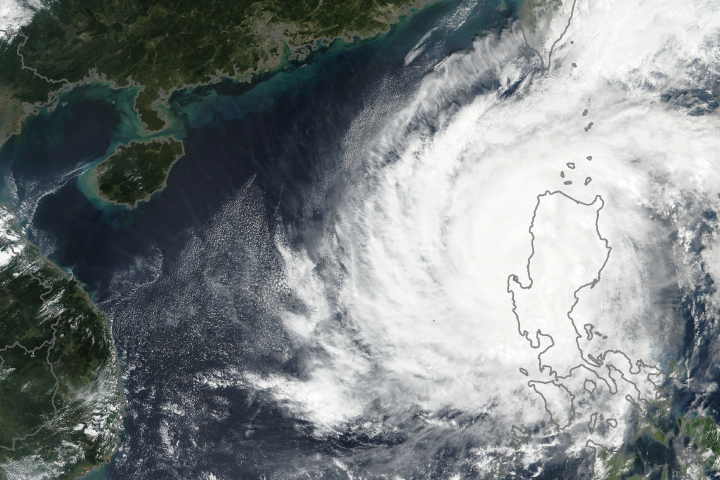
The Moderate Resolution Imaging Spectroradiometer (MODIS) on NASA’s Aqua satellite captured the first image at 1:10 p.m. (05:10 Universal Time) on October 28, 2018. Fifteen minutes earlier, CloudSat passed over the eye of Yutu, as the storm approached the Philippines. The second image shows a cross-section from CloudSat—how the storm would look if it had been sliced near the middle and viewed from the side.
At the time, Yutu had sustained winds of 220 kilometers (140 miles) per hour and a minimum barometric pressure of 933 millibars, making it the equivalent of a Category 4 storm. However, it was weakening after slamming into the Mariana Islands and moving over an area of relatively cool water.
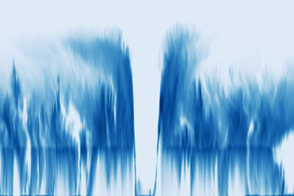
The darkest blues in the CloudSat data represent areas where clouds and raindrops reflected the strongest signal back to the satellite radar. These areas had the heaviest precipitation and the largest water droplets. The blue horizontal line across the data is the melting level; ice particles were present above it, raindrops below it. Note how the radar detects more signal immediately below this line. (The exception is where raindrops are particularly large. In these areas, such as the center of the storm, CloudSat loses the signal).
“Cloudsat’s radar revealed the cirrus-free eye and an outward sloping eyewall, a feature typically found in intense tropical systems,” said Tourville. “The southern portion of the eyewall appears more disorganized, as the thicker cloud tops are starting to disintegrate from the top down.” Yutu’s clouds rose to about 14 kilometers (9 miles) altitude at their highest point—fairly high for a tropical cyclone.
In February 2018, mission engineers at NASA’s Jet Propulsion Laboratory lowered the aging satellite’s orbit from 705 kilometers (440 miles) above the surface to 688 kilometers because of the loss of one of its four reaction wheels—devices that help control the spacecraft’s orientation.
Another Earth-observing satellite, Cloud-Aerosol Lidar and Infrared Pathfinder Satellite Observation (CALIPSO), recently joined CloudSat in something orbital engineers have dubbed the “C-Train orbit.” CALIPSO and CloudSat now fly just 4 kilometers (2 miles) apart—9 seconds of flight time.
Like CloudSat, CALIPSO also has a narrow track and collects data about the vertical structure of the atmosphere. It excels in detecting especially fine-grained ice particles, aerosols, and water droplets. For several years, CloudSat and CALIPSO flew near each other as part of the Afternoon Constellation, or A-Train of satellites, a strategic type of formation flying designed to maximize the scientific value of the data collected by Earth-observing satellites.
NASA Earth Observatory image by Joshua Stevens, using MODIS data from NASA EOSDIS/LANCE and GIBS/Worldview, and CloudSat data provided by the CloudSat team at Colorado State University. Story by Adam Voiland.