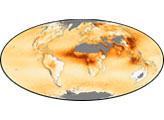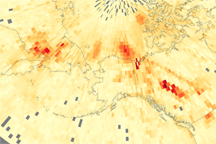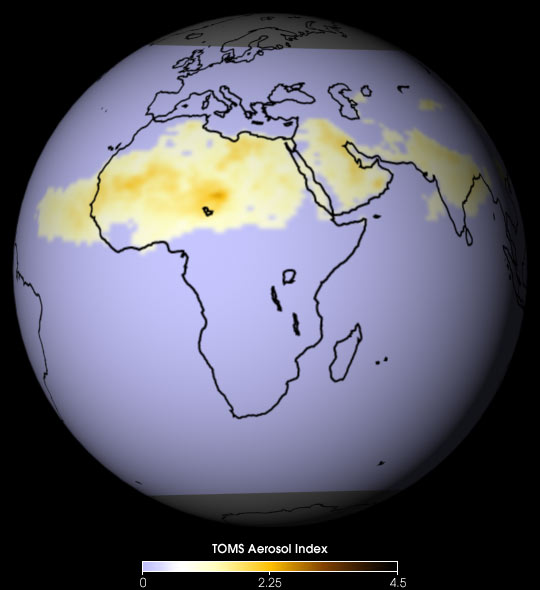
Scientists use data from NASA’s Total Ozone Mapping Spectrometer (TOMS) to measure the relative amount of aerosols—solid or liquid particles suspended in the atmosphere. Examples of such aerosols include dust, volcanic ash, and smoke. This false-color image is a map of where there are aerosols that absorb ultraviolet (UV) radiation. Brown pixels show higher aerosol concentrations, while yellow pixels show lower aerosol concentrations, and light blue regions indicate little or no aerosol.
This image, from April of 2000, shows dust blowing from the Sahara Desert into the Atlantic Ocean, more dust from the Rub al Khali and Nafud deserts of the Arabian Penninsula, and what may be smoke over northern India.
The TOMS aerosol index is related to aerosol optical depth, which, in turn, is a measure of how much light airborne particles prevent from passing through a column of atmosphere. (Aerosols tend to absorb or reflect incoming sunlight, thus reducing visibility and increasing optical depth and aerosol index.) For aerosol plumes at the most common height of 3 km, a TOMS aerosol index of less than 0.1 indicates a crystal clear sky with maximum visibility, whereas a value of 4 indicates the presence of aerosols so dense you would have difficulty seeing the mid-day sun. (The relationship between aerosol index and optical depth is dependent on altitude. Aerosols at low altitudes have a lower TOMS aerosol index than an equivalent depth of aerosol at a higher altitude).
Every day, TOMS measures the amount of UV radiation that is absorbed by the atmosphere and how much is reflected back up into space. Scientists use these daily measurements to estimate the location and amount aerosols present in the atmosphere over the entire Earth
TOMS aerosol index data and images.
Image data courtesy TOMS science team, NASA Goddard Space Flight Center